Tuning a system to pinpoint breakouts at the very start of a cycle, but also the start of dumb money volatility near the end of a cycle.
- Is the advisor suitable for real life?
- Advisors that work
- The market is a controlled dynamic system.
Here's a system I've been workin on for quite some time. Feel free to take advantage of it, but make sure you give me some thoughts to try and enhance it.
makes me nervous
Here's a good remedy to that problem Pava.....probably the only one come to think of it.
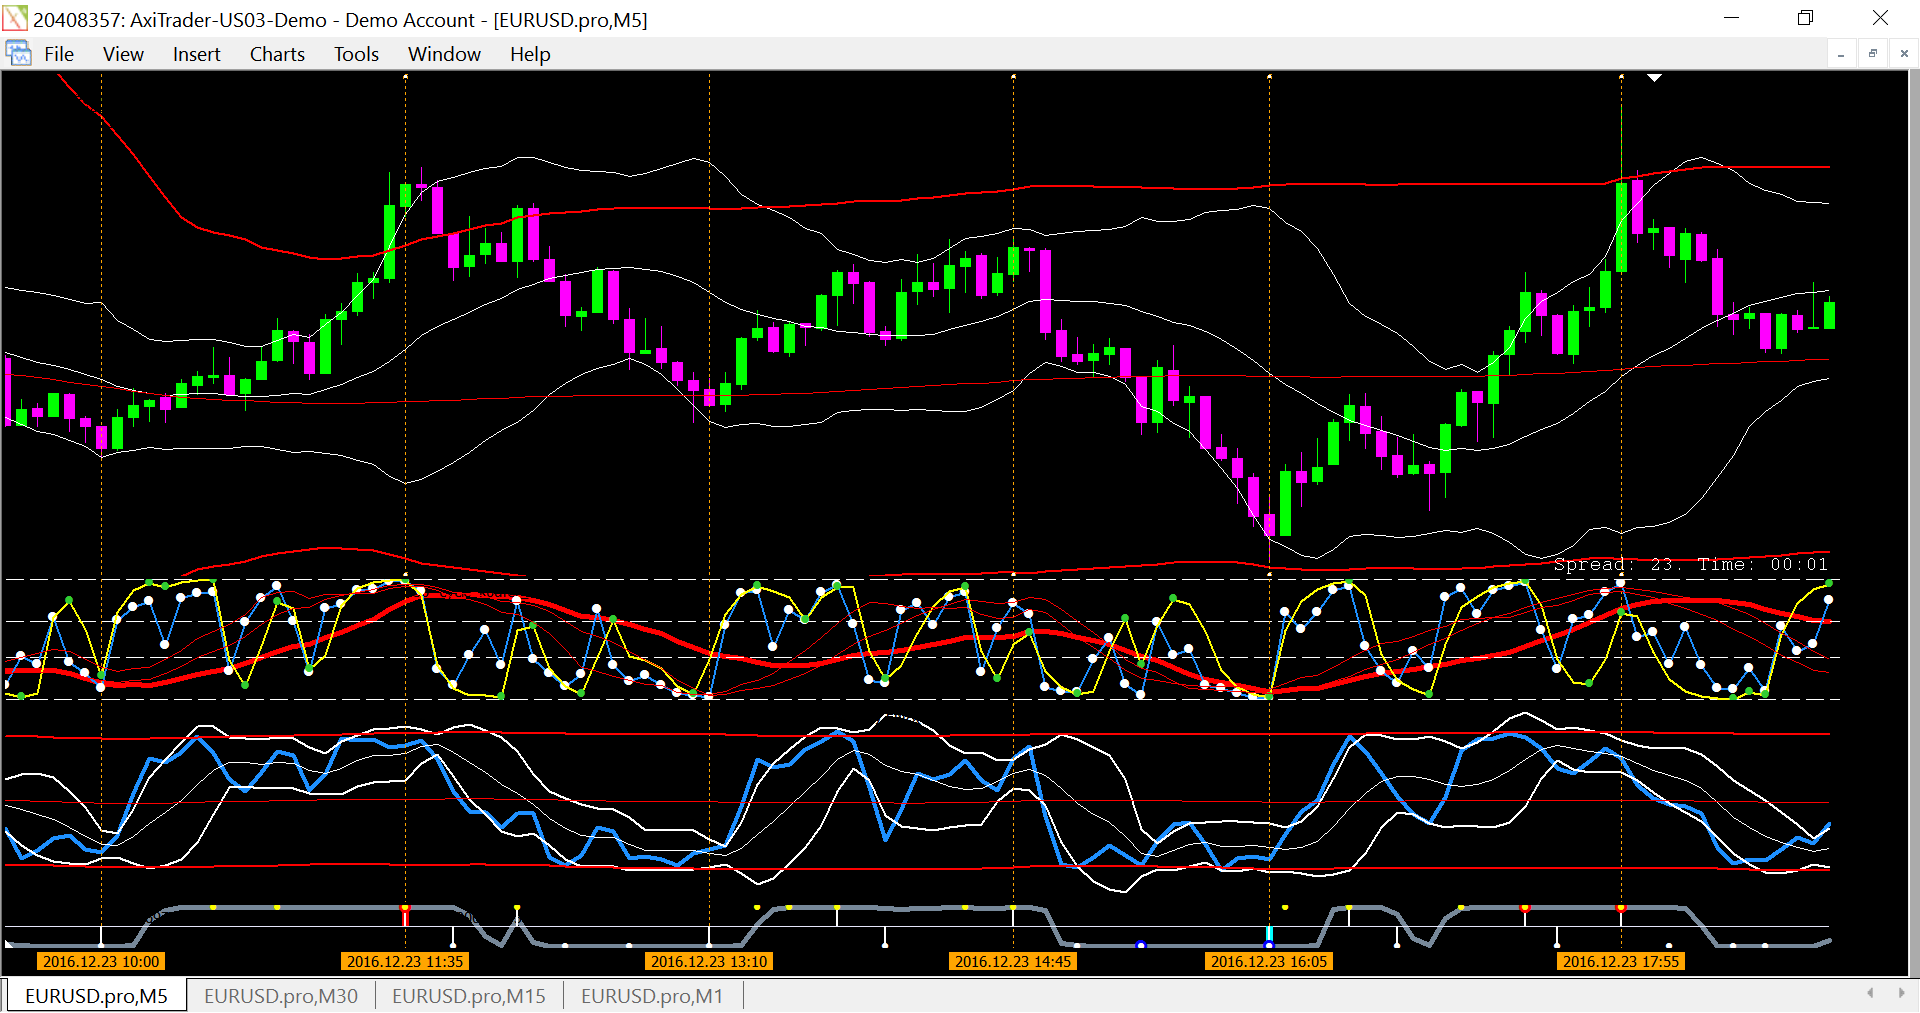
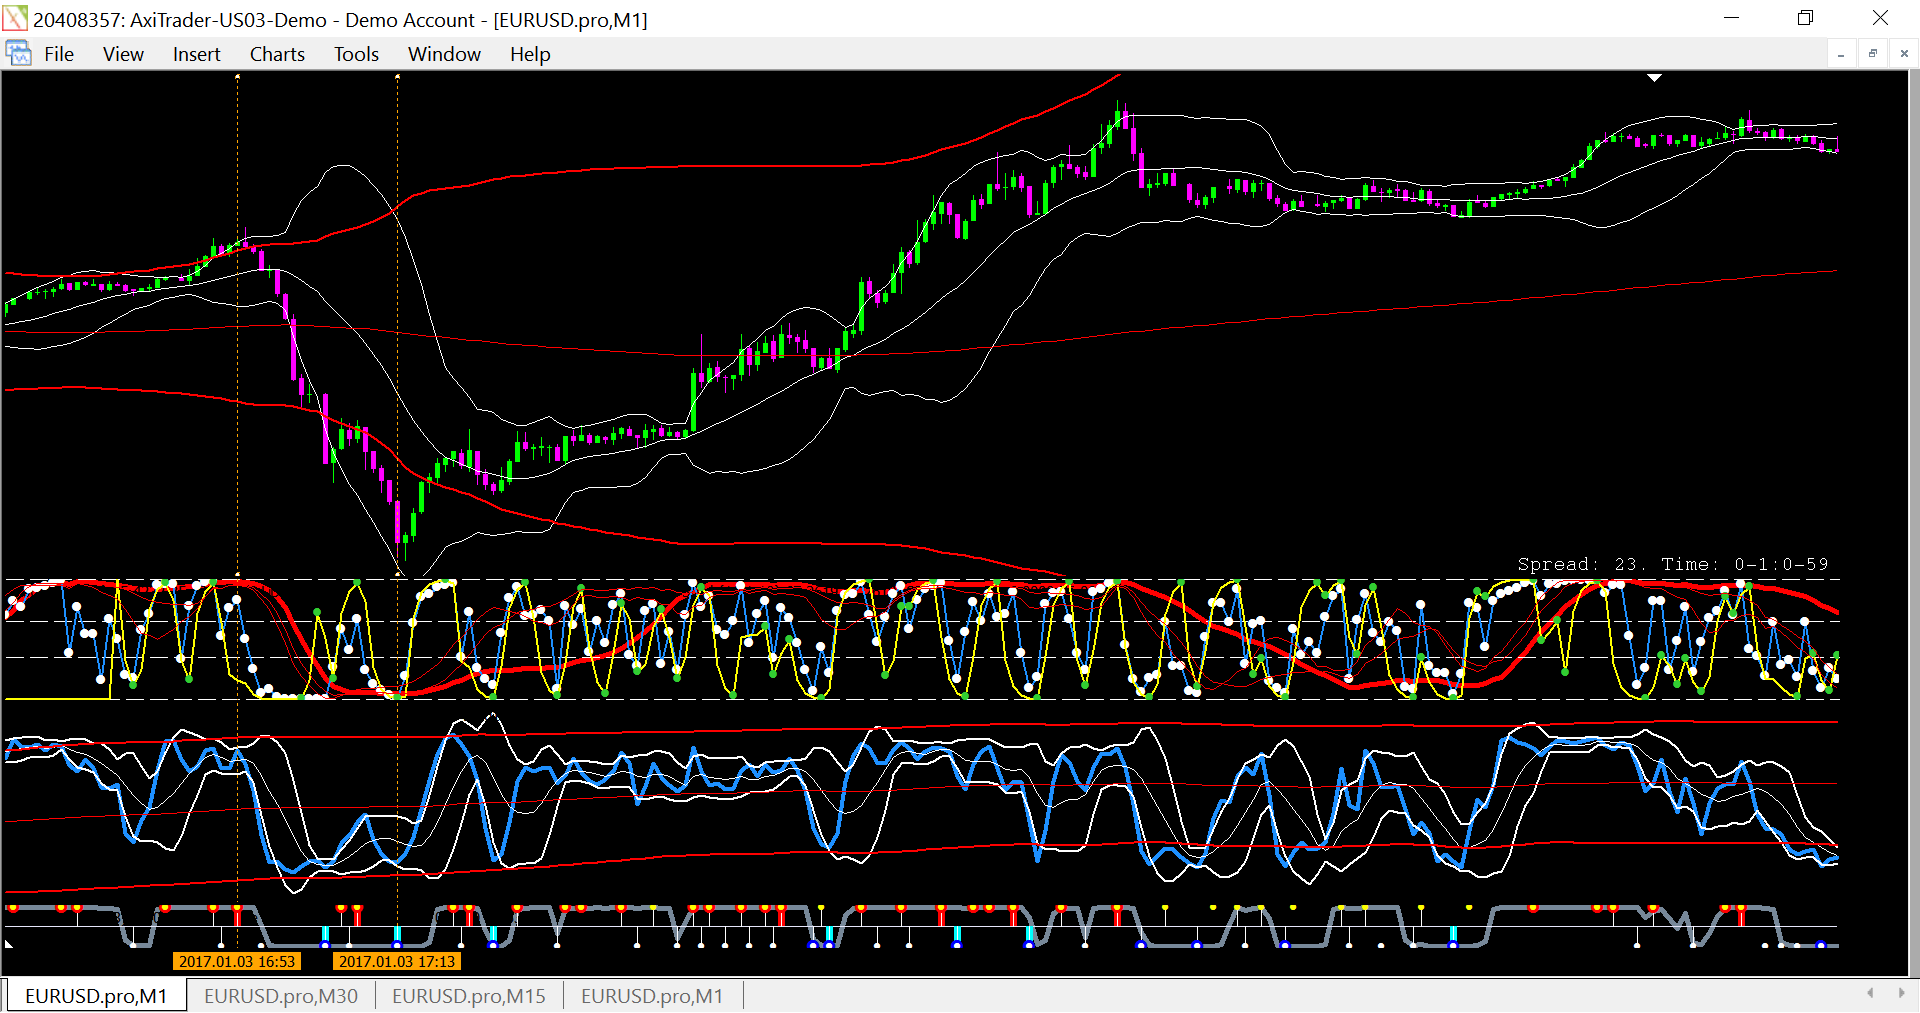
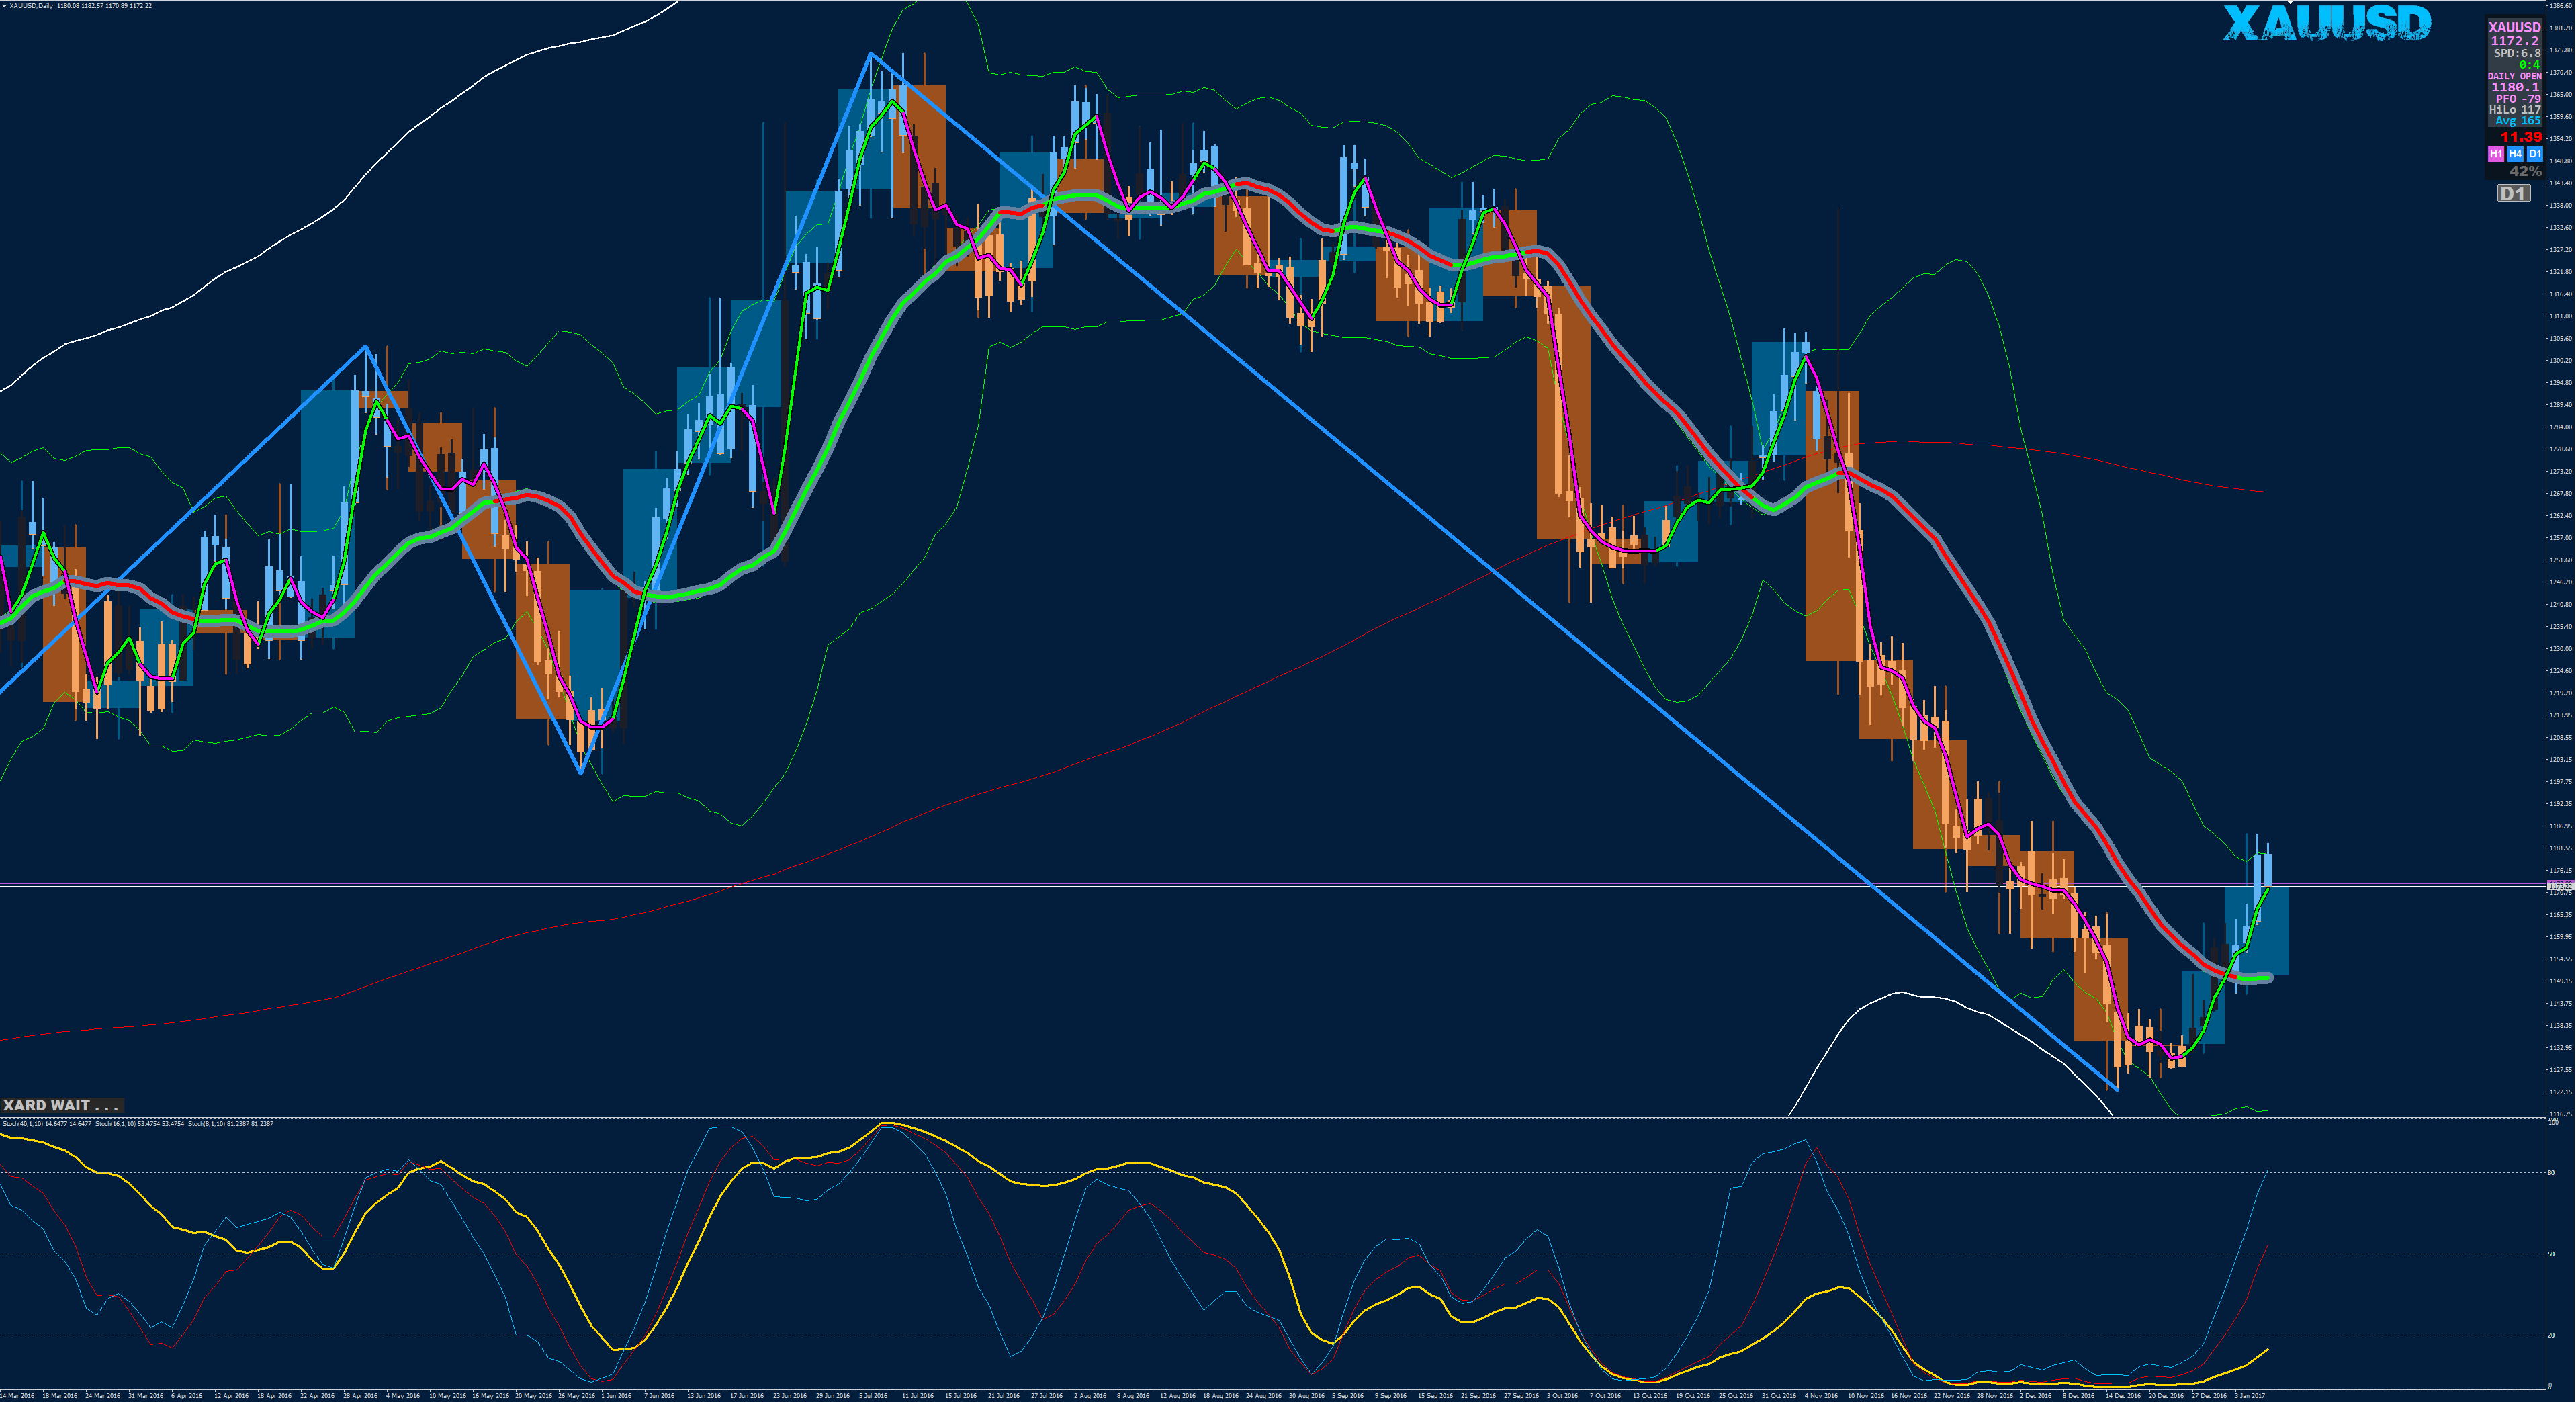
Only take trades when the large red 40 stoch is moving in a direction, or more effectively, when the two faster red stochastics show that there's going to be a direction change with the 40. Notice that the highest price action takes place when the green and yellow koufer cycle has gone above 65 line or bellow 35 line, just prior to reversal. I call that the stoploss kill zone......The harder it pushes against the 0 or 100 line prior to reversal breakout, the quicker you'll be stopped out if you're too early.......Wait for symphonie indicator to signal whilst keeping an eye on the red stochastics.
A prime area to watch for the greatest price action is when blue dynamic zone stoch indi is bouncing off the slower red upper and lower dzs, whilst keeping an eye on the three red stochastics, again, for that direction change. Also for the greatest price action, the white bb will squeeze up on the DZS........wait for the SEI v3 signal, notice the direction of the red stochs, or that possible change according to the faster red stochs, wait for the bar to close, and get ready for action. The i-shark overbought/oversold indi overlaid with the SEI v3 works with that as well.
The SEI v3 does repaint, but you'll notice that with a back test, the history dots are still potentially profitable, make sure you're always looking back to the 1 min chart to know when to cut trade, using the same system in reverse. Come up with your own stoploss system. I use Bemac trademanager, it's free.
I like to use the fast moving blue and white RSI Lido to really define the direction of the volatility, where all the weight is in real time, it tells me early if i've jumped in too prematurely judging by where the volatility is in its pendulum action.
If you can master dumb money volatility trades just prior to reversals, focus on those trades at the normally worst times, ie, in the morning. Trade reversals primarily, at the normally good times.
As always, only take trades as close as possible to the bar close.
------------------------------------------------------------------
Be wise as serpents, and harmless as doves.

In the template there is a complete system.
Picture-such

In the template there is a complete system.
Picture-such
Yepp, please complete the tpl.
In the template there is a complete system.
Picture-such
Iv'e based my ideas off Anne-Marie Baiynd's correct use of stochastic settings and overlays, and I'm attempting to define it down to a molecular level. Here's a very informative video.
"In this one hour class, Anne Marie will walk you step by step through actual past trades from Tradingbook.com that illustrate the clear principles surrounding how she uses her favorite, and often overlooked, momentum based indicator.
Join us for this high impact, career changing webinar to discover one of the most reliable indicators in all of technical analysis. Consistent results come from structured and straightforward trading, and that's exactly what this indicator helps you achieve."
https://www.youtube.com/watch?v=UCazDCsHsC0
Sound cuts out around 16 minutes for a little bit.
- Free trading apps
- Over 8,000 signals for copying
- Economic news for exploring financial markets
You agree to website policy and terms of use