intraday trading system
market timing tip: it's better to synch your position with market openings
rule: upper band of regressions is an overbought level only in bearish moves and lower band is support (oversold) only in bullish moves.
stop loss : i normally set my stop loss 10 pip higher than the latest extreme which i entered with !
take profit : u can use higher time frame extremes but never close a position when super smoother 10 is trending . (u can change in direction of m5 as a exit signal). keep in mind this strategy is for catching trends ! so catch a trend !!
entry tip: it doesnt matter which signal entry u use but it must be inline with one significant upper time frame trends (h4 for m30 entries or h1 for m15)!
p.s: sometimes higher & lower time frames are trending in opposite direction or u're encountering a large candle . in my opinion stick to the strategy anyway but maybe use tighter stop/loss or exit earlier than usual .
p.p.s: i personally shift the regression one bar to the left just in case !again u can fine tune periods with dominant cycles but it wouldn't help that much when u use 3 time frame for finding trends and sup/res .
one super important note : regression & super smoother are dynamic indicators so check them every bar !
i would post 2 signals tomorrow based on this strategy to see how it works in real time .
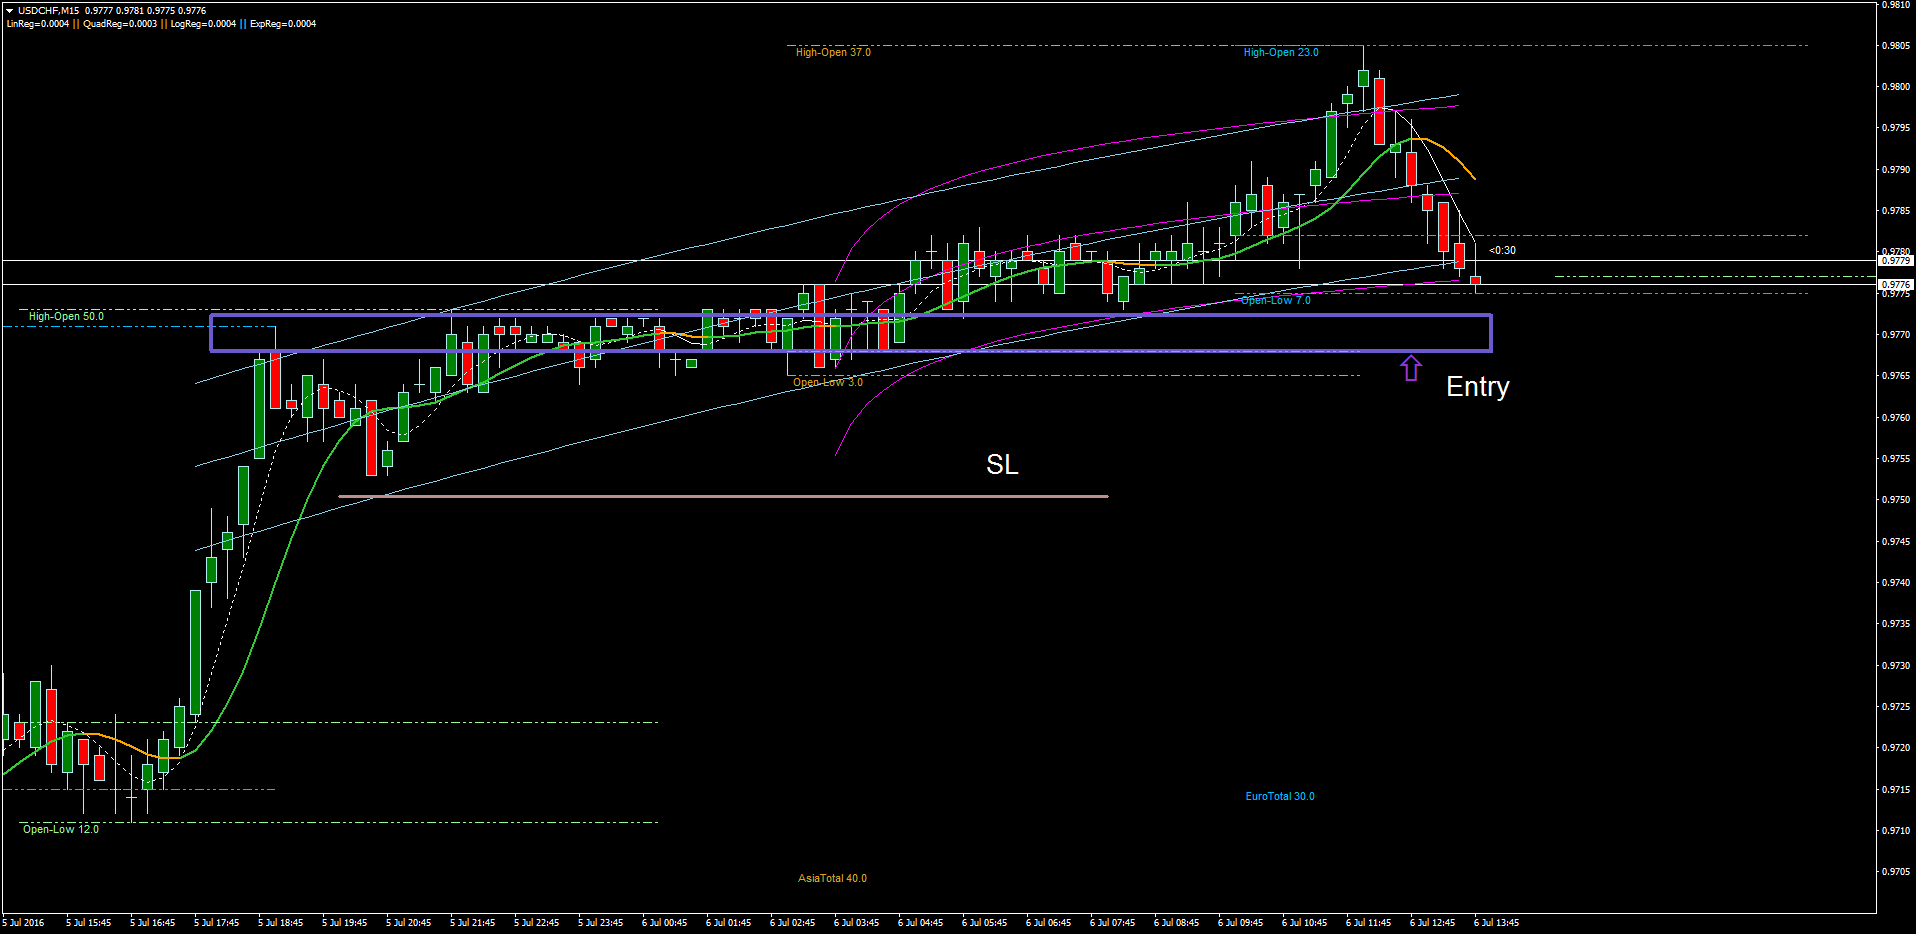

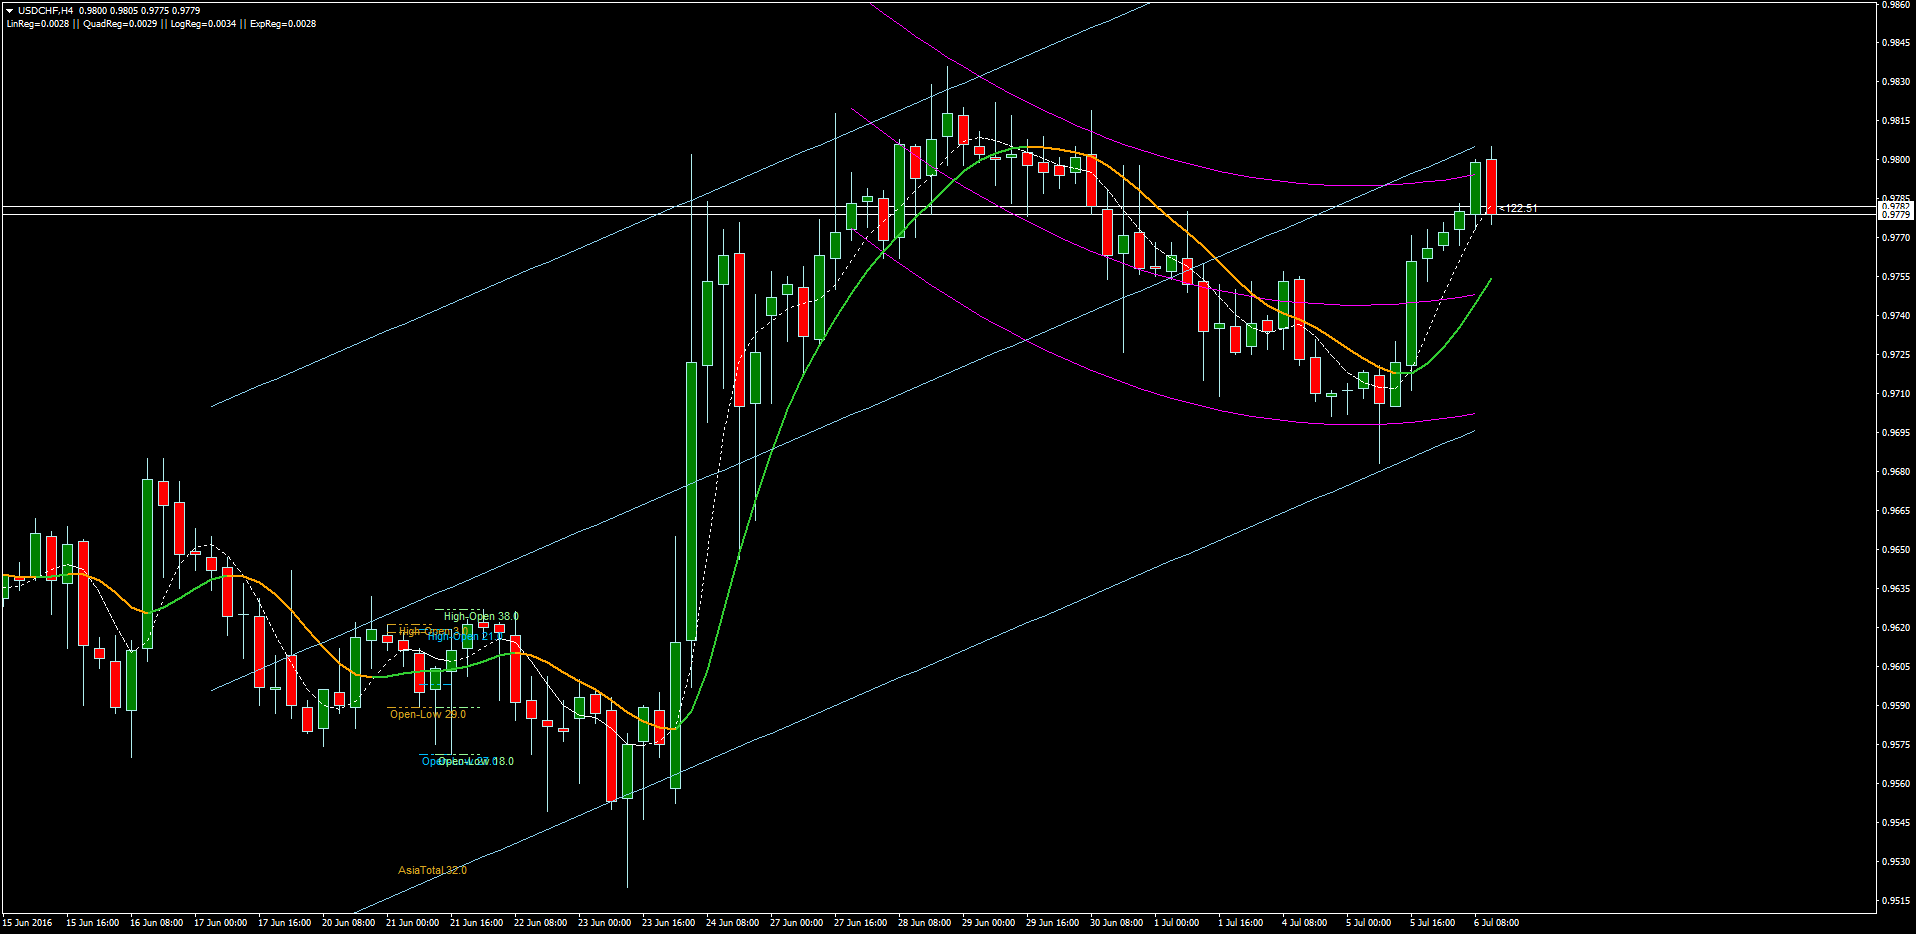
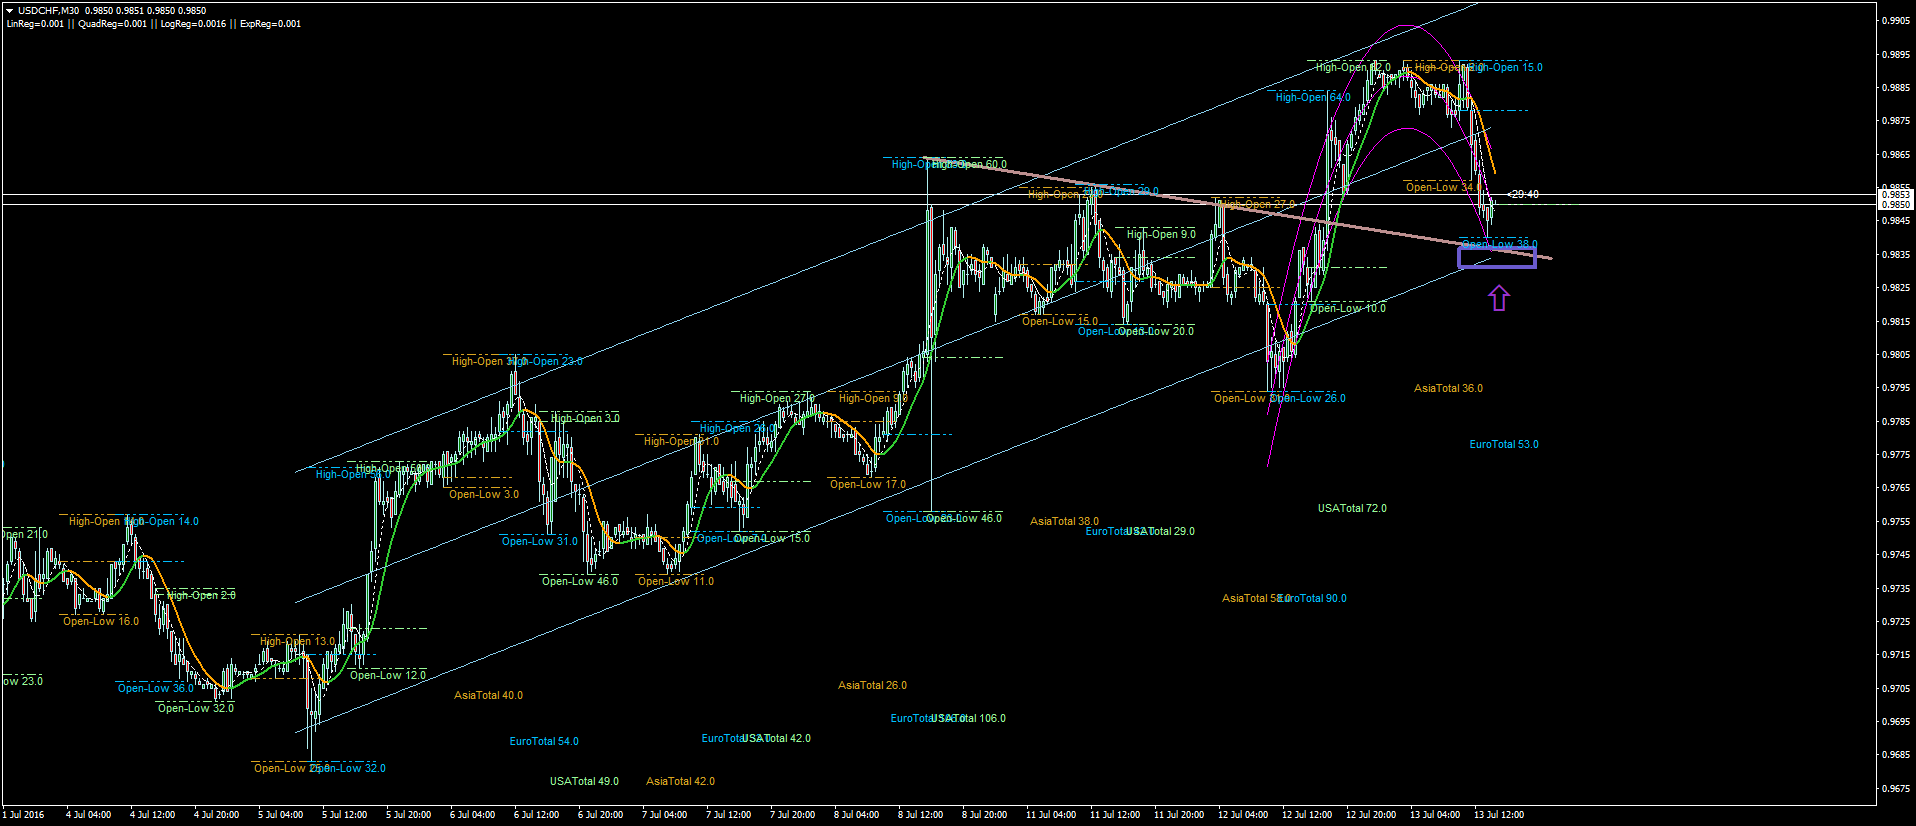
here's a good setup for usdchf . almost all time frame are bullish . there's two possible entry for buy : one is @.9700 because of h4 & other one is happenin right know @.9770 . it's seems risky though given that price is close to important high & dollar news coming out . from risk/reward point of view it's close to 1/1 (unless u follow the trend) . i would definitely buy @.9700 but not sure about entering the market right know . again this is supposed to be an example !
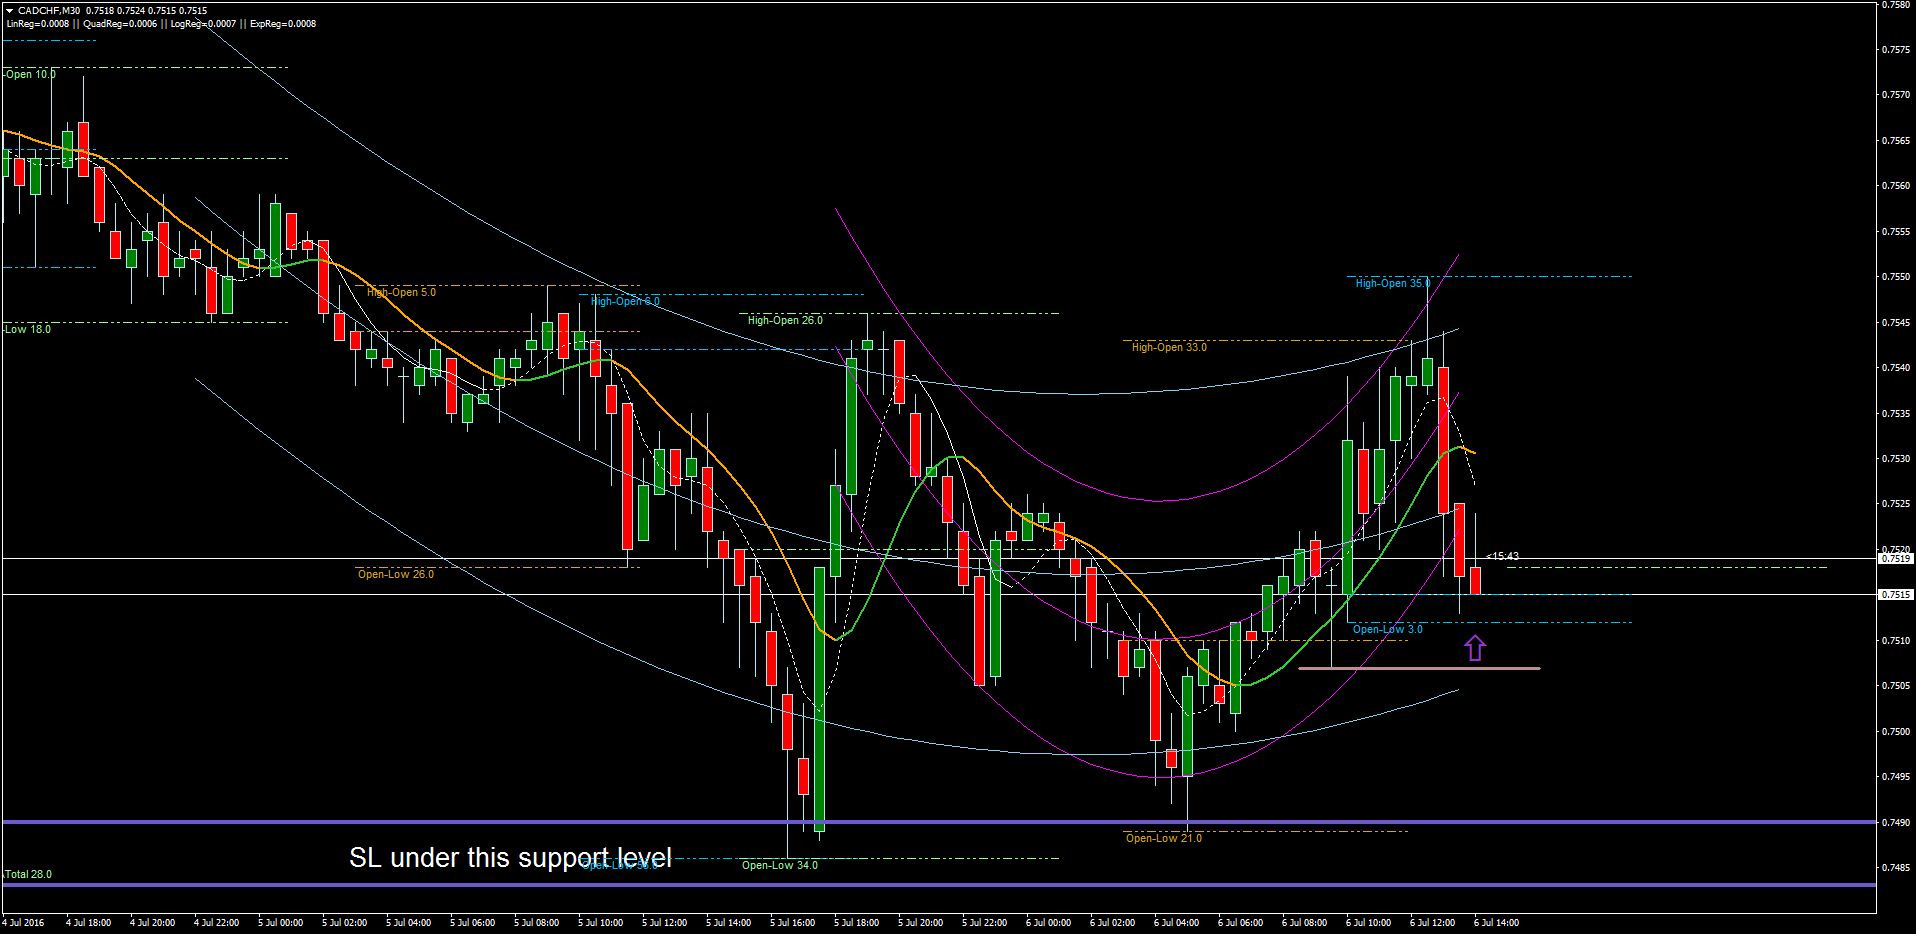
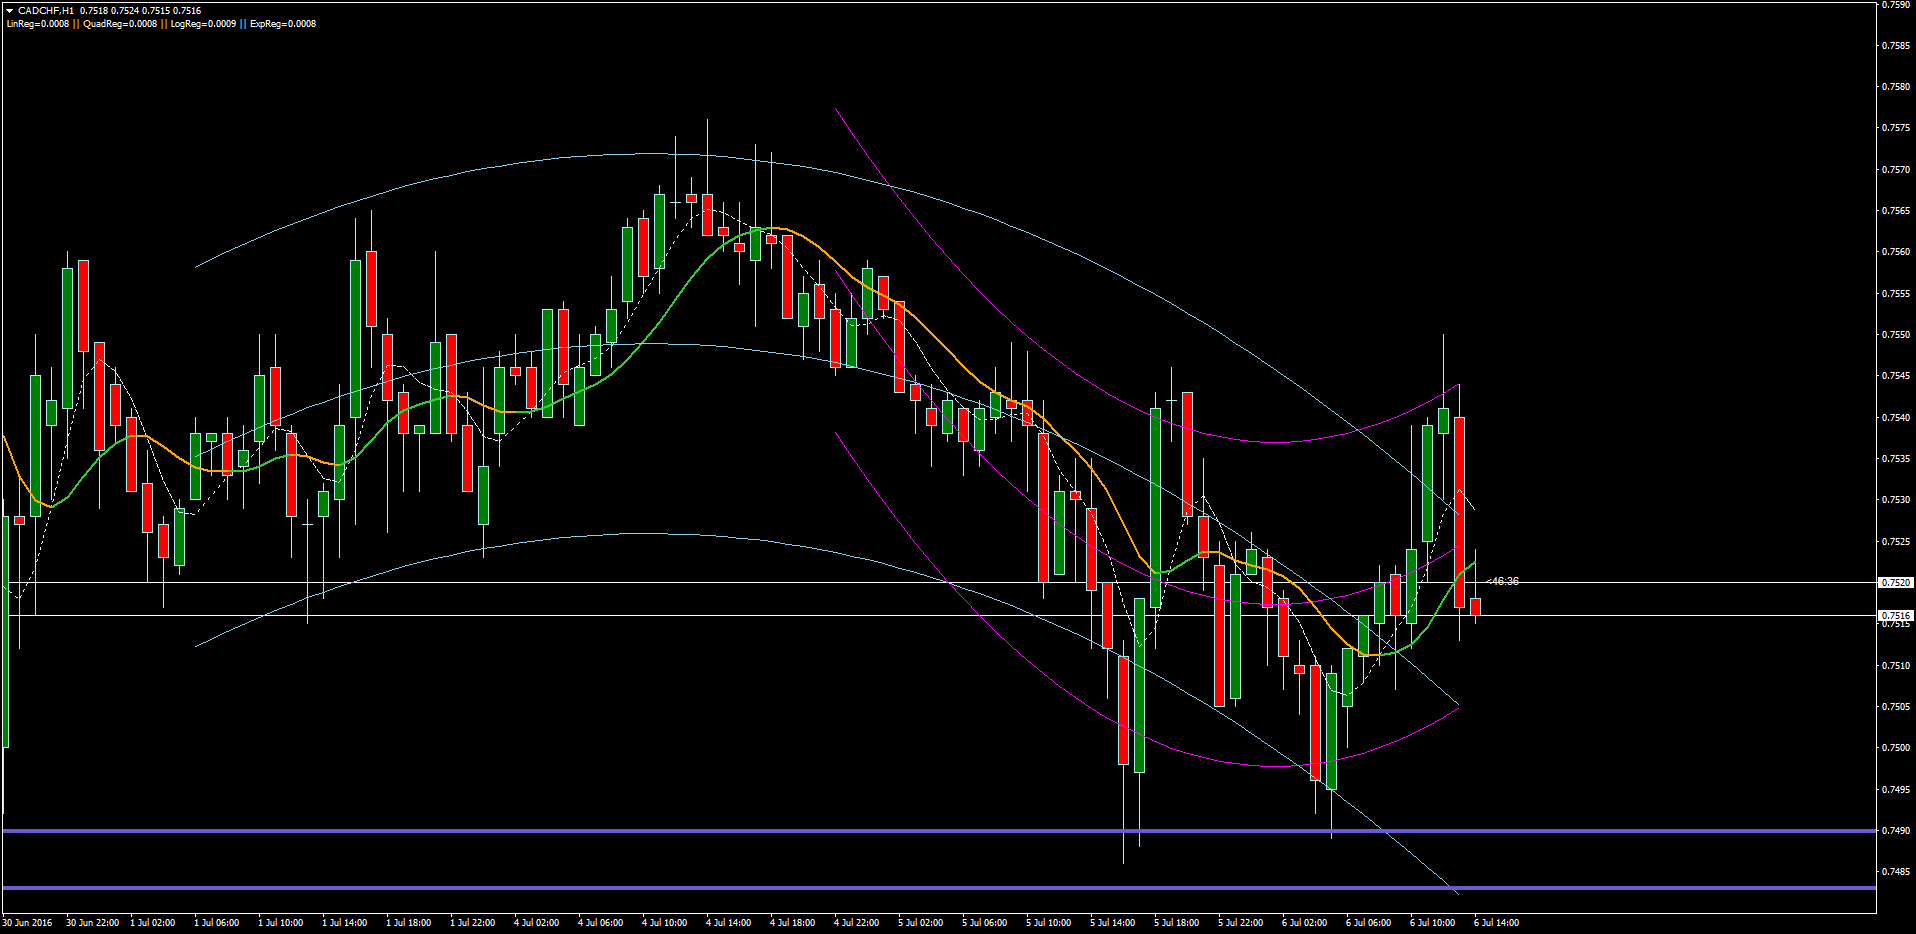
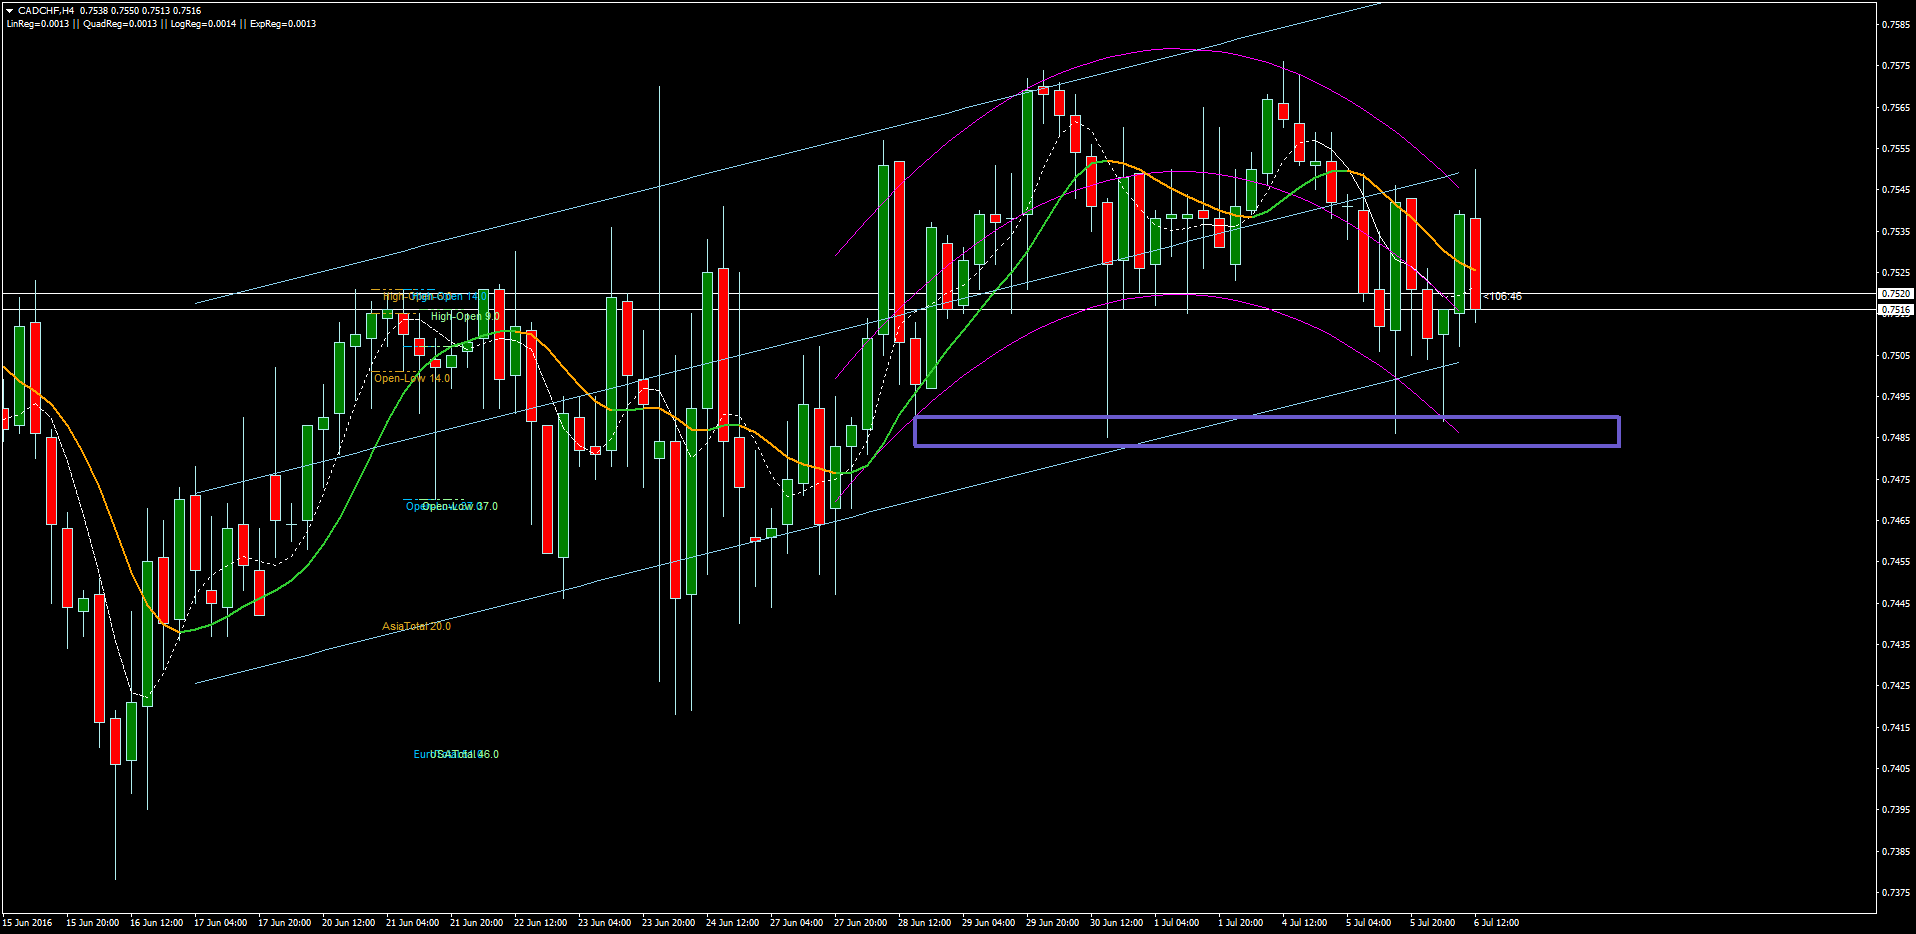
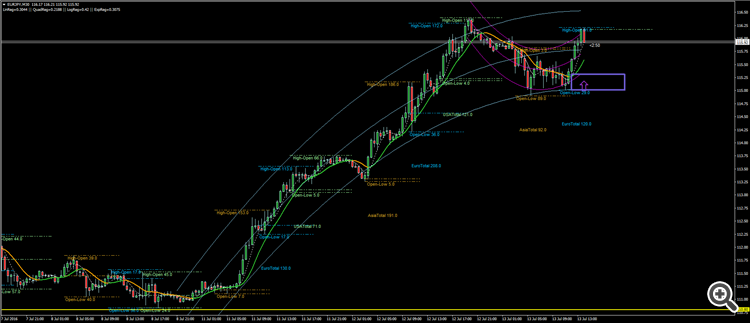
another perfect example of strategy on CADCHF , long story short:
h4: swingy with a bull bias , h1:swingy with short term bull bias m30: bullish
it has a pretty good risk/reward ratio , only concern is reg80 h1 but that's fine cause price has enough bull signs in other time frames . just wait for buy signal @m15 o @m30 . i talked about synching position with market timing , this a good example of it . right know we are in london session and this pair is bullish from start of today session !
p.s: there's a news coming out for CAD 1 hour from now so be cautious
i decided to post an example for fine tuning the periods with dominant cycle (without goertzel or autocorrelation) .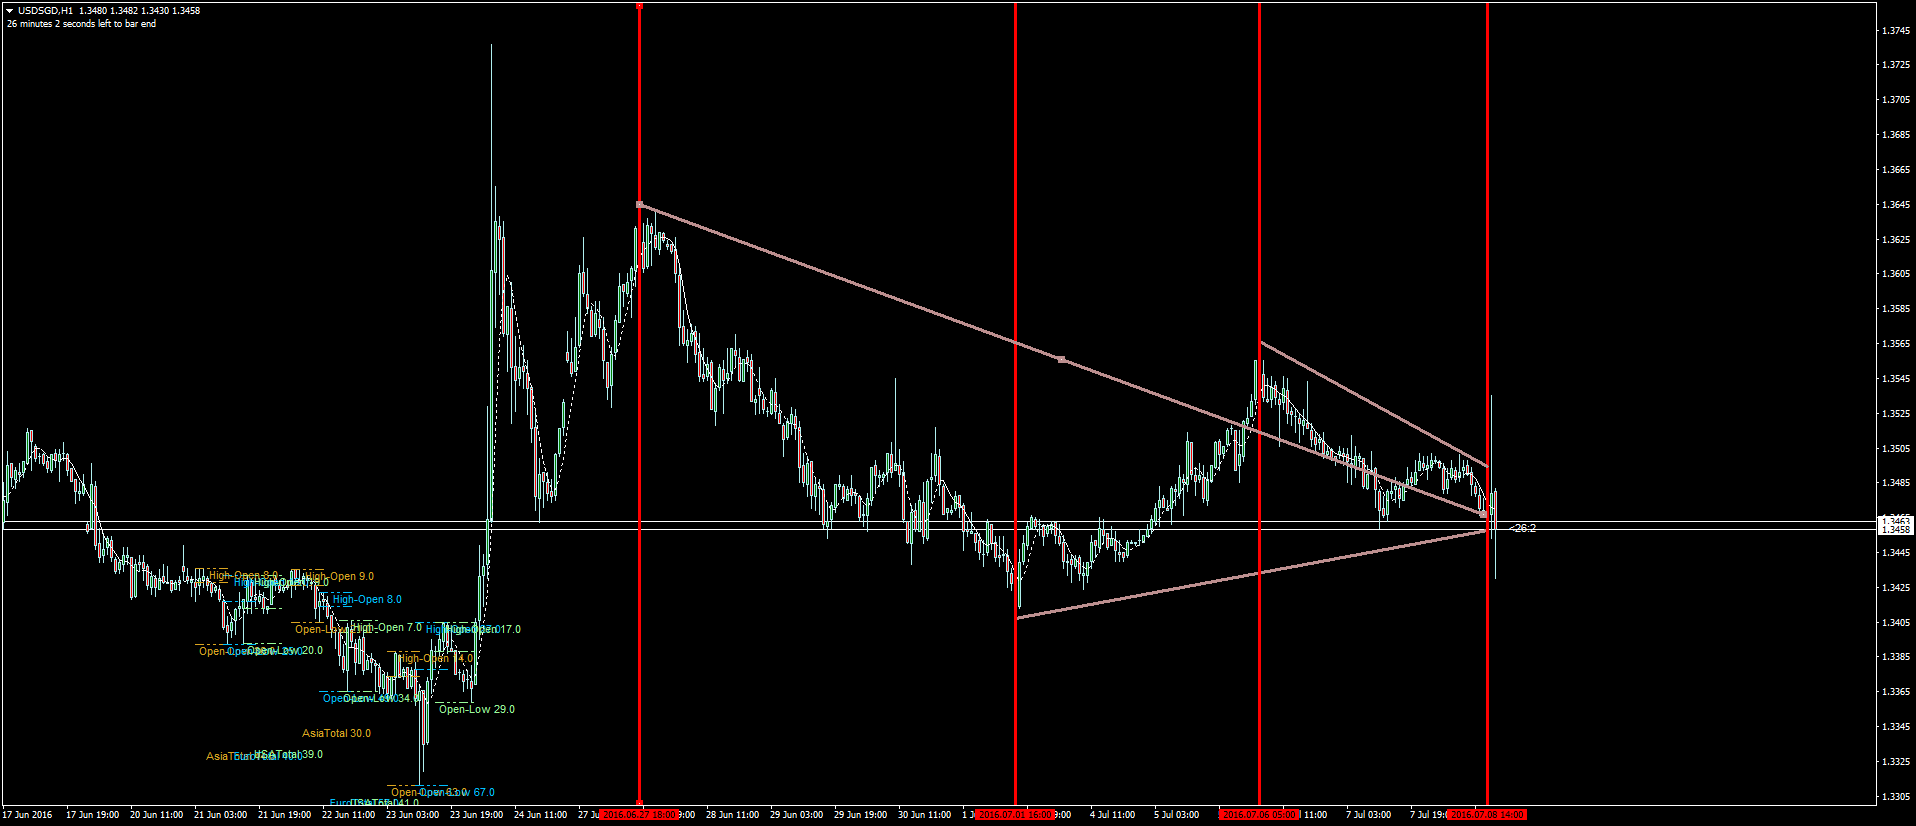
this h1 chart for usdsgd . there are 3 major moves influencing the market (i'm just talking about h1) periods are 60 bearish- 120 bullish - 210 bearish . so clearly dominant cycle is either 60 or 30 (both of them are fine )! simple as that ! then i set periods for regression analysis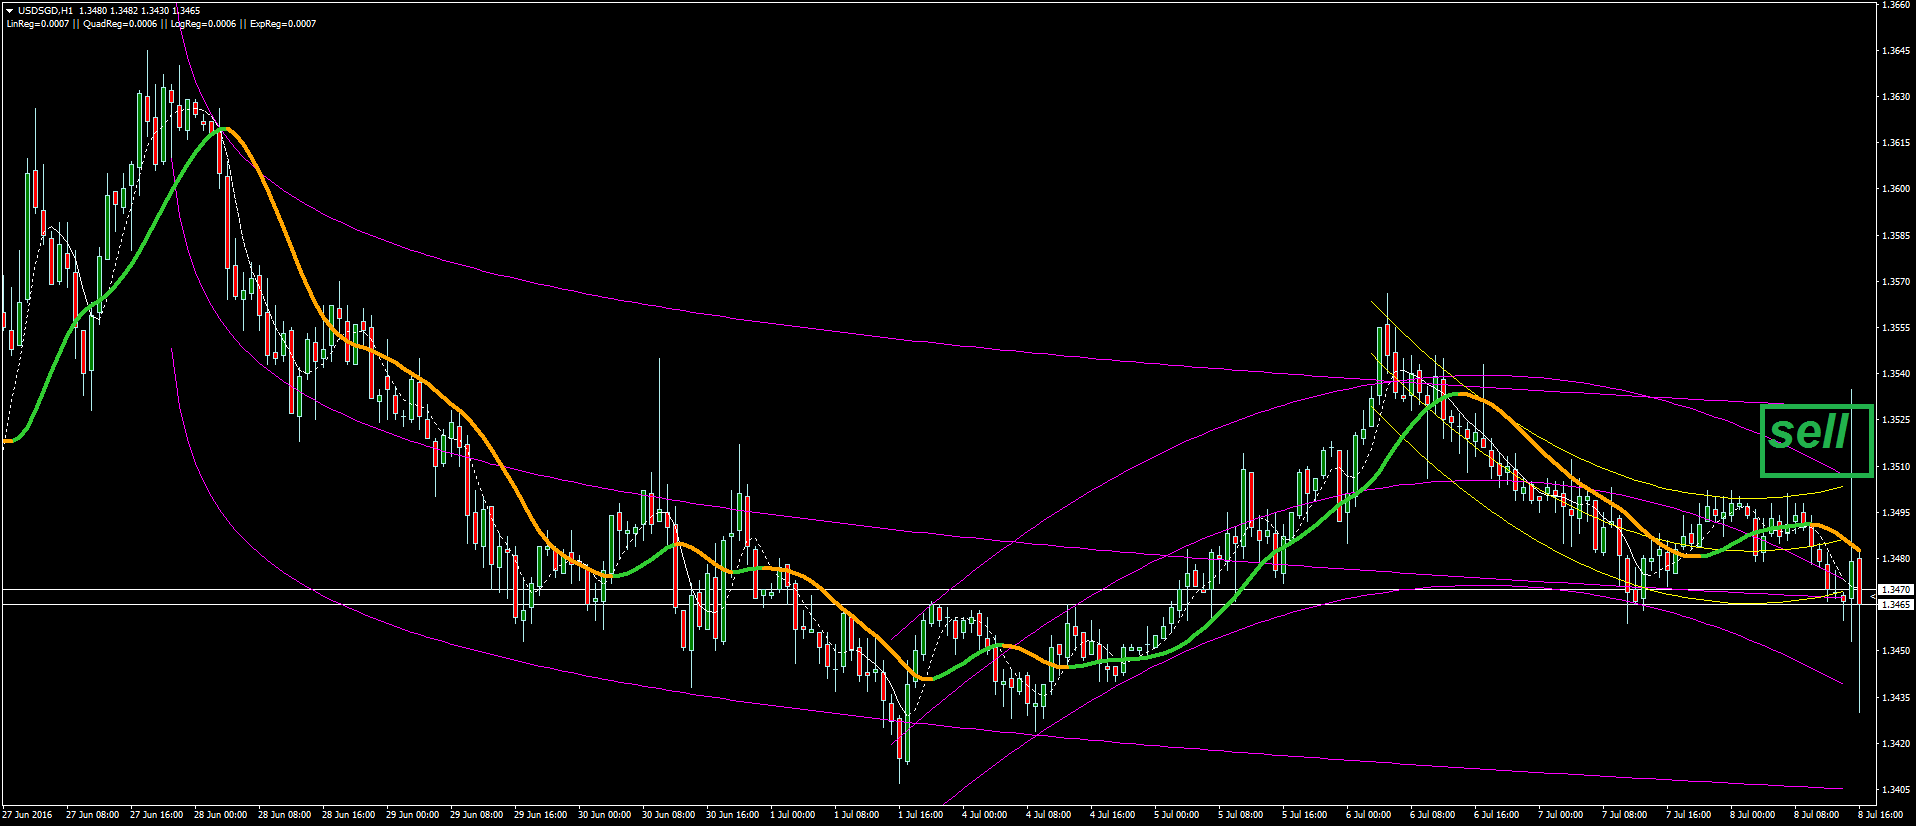 and super smoother . keep in mind i shift regressions 2 candle to the left because news came out in this bars and i wanted to show u how this setup would look like before this crazy swings would happen ! as u can seel all three of them are bearish so the upper band is good time to sell !
followin picture is what i would be look like if u use default periods (20/40/80)
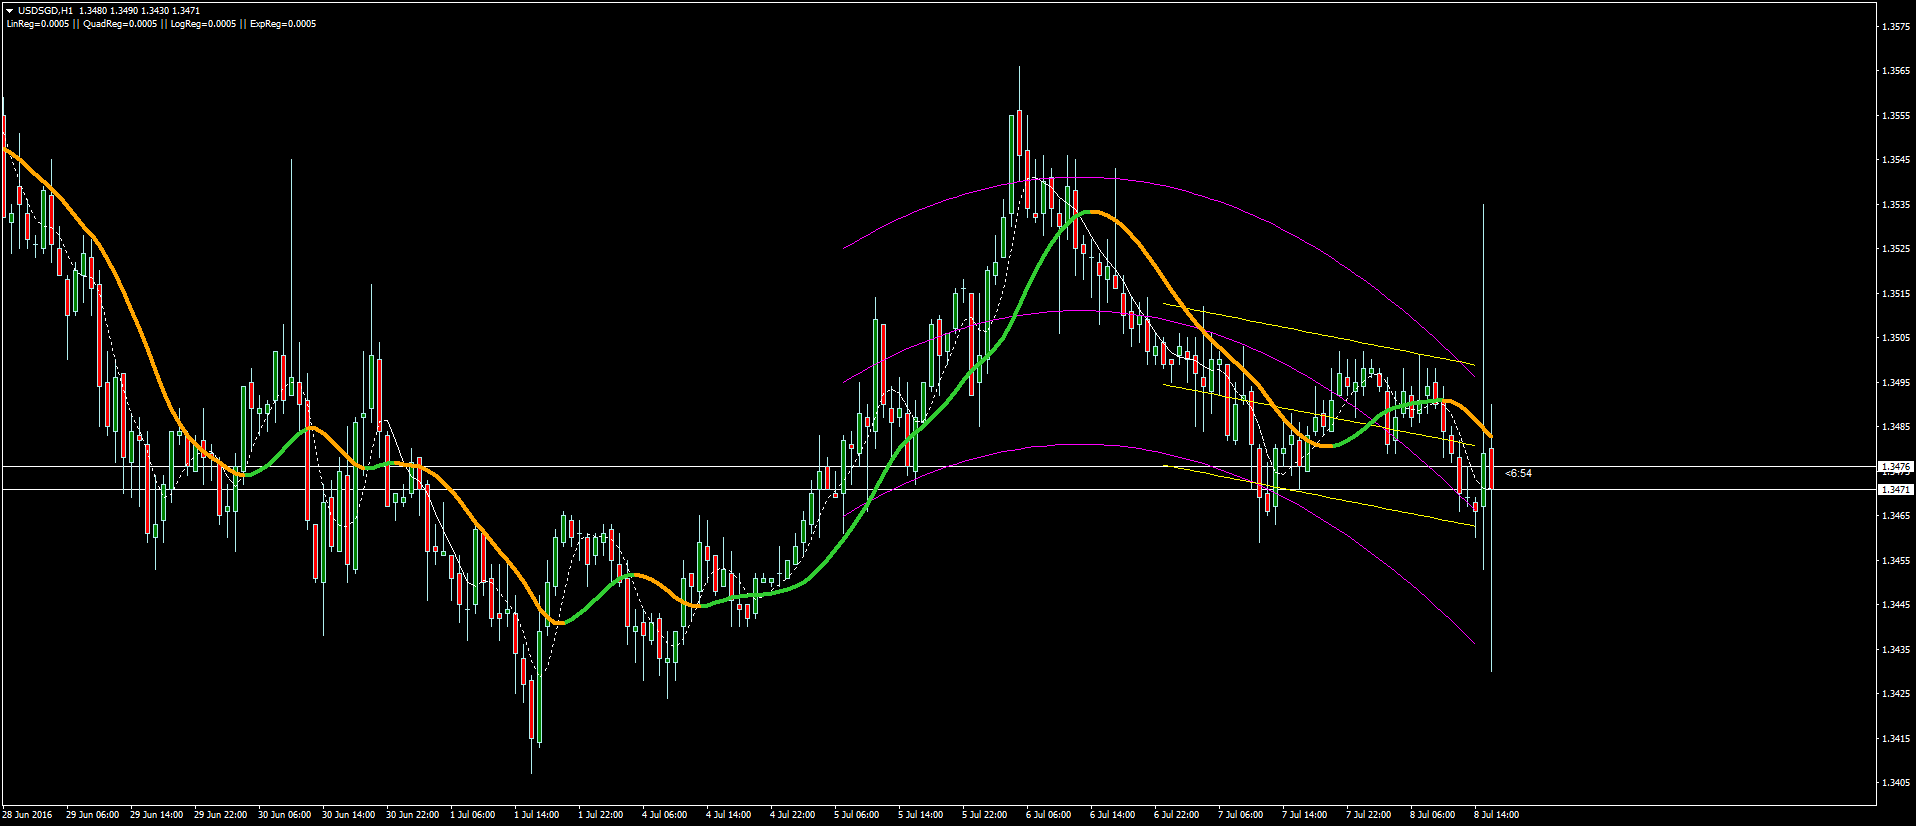
of curse tuned version looks better but with default periods u're still on "right side" of market & that's all that matters
p.s: regression indicator tries to fit the best regression mode for data, because of that normally there's not much difference between small period changes
i wanted to share my intraday trading system with u guys , so here it goes :
2 indicator is needed : one is supersmoother(or any filter with fast smooth response & low lag ) another one is regression analysis indicator (https://www.mql5.com/en/code/10249)
simply add 2 super smoother to chart with periods 10 & 20(*) , these 2 would give pretty much the momentum and trend direction based on close
add 2 regression with periods 40(*) & 80(*) , these 2 are necessary for finding the bigger picture ,market conditions () & range of cycles .
goal is finding a trend in higher time frame and best time to enter
* : u can find tune these periods with dominant cycle by goertzel or autocorrelation periodogram but dont change the 10 period supersmoother
Big system you have there, nothing for newbies, I guess, and it needs longer forward testing to understand.


i just remembered something , it's kinda seems obvious but, in case of using cycles for setting indicator's periods , u have to update the period for regression indicator !! doesn't mean u have to add one 1 period every candle but maybe do that every 4plus candle .
i got stopped in gbpusd(-20) but usdchf(+20) is going well . there was "somehow okay" buy position @eurgbp m30** i didn't take . pretty good sell position at oil h1 before news release (i dont trade oil so ) & buy chfcad m30 too (of course news could go either way)
maybe it's not bad to use pending orders cause it gives really good risk reward ratio & tight stops ! **or enter the market even though larger regression is against the shorter period regression especially when supersmoothers 10&20 are confirming it too. this means taking more position & spreads !
how to help goertzel browser + finding dominant cycle !
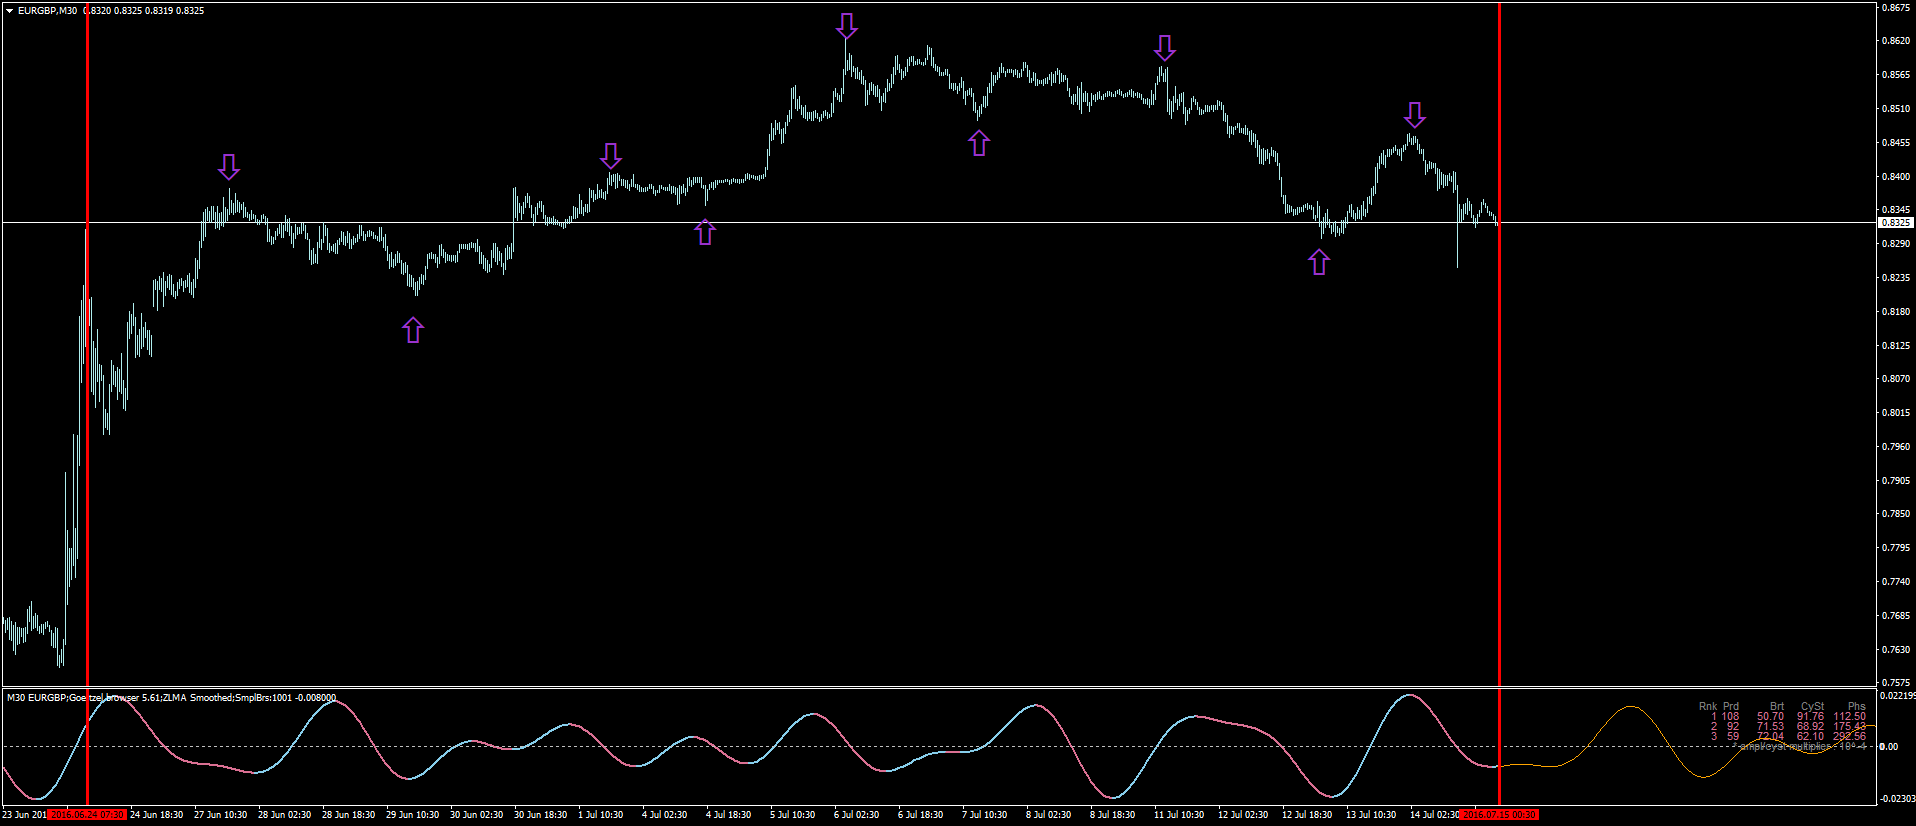
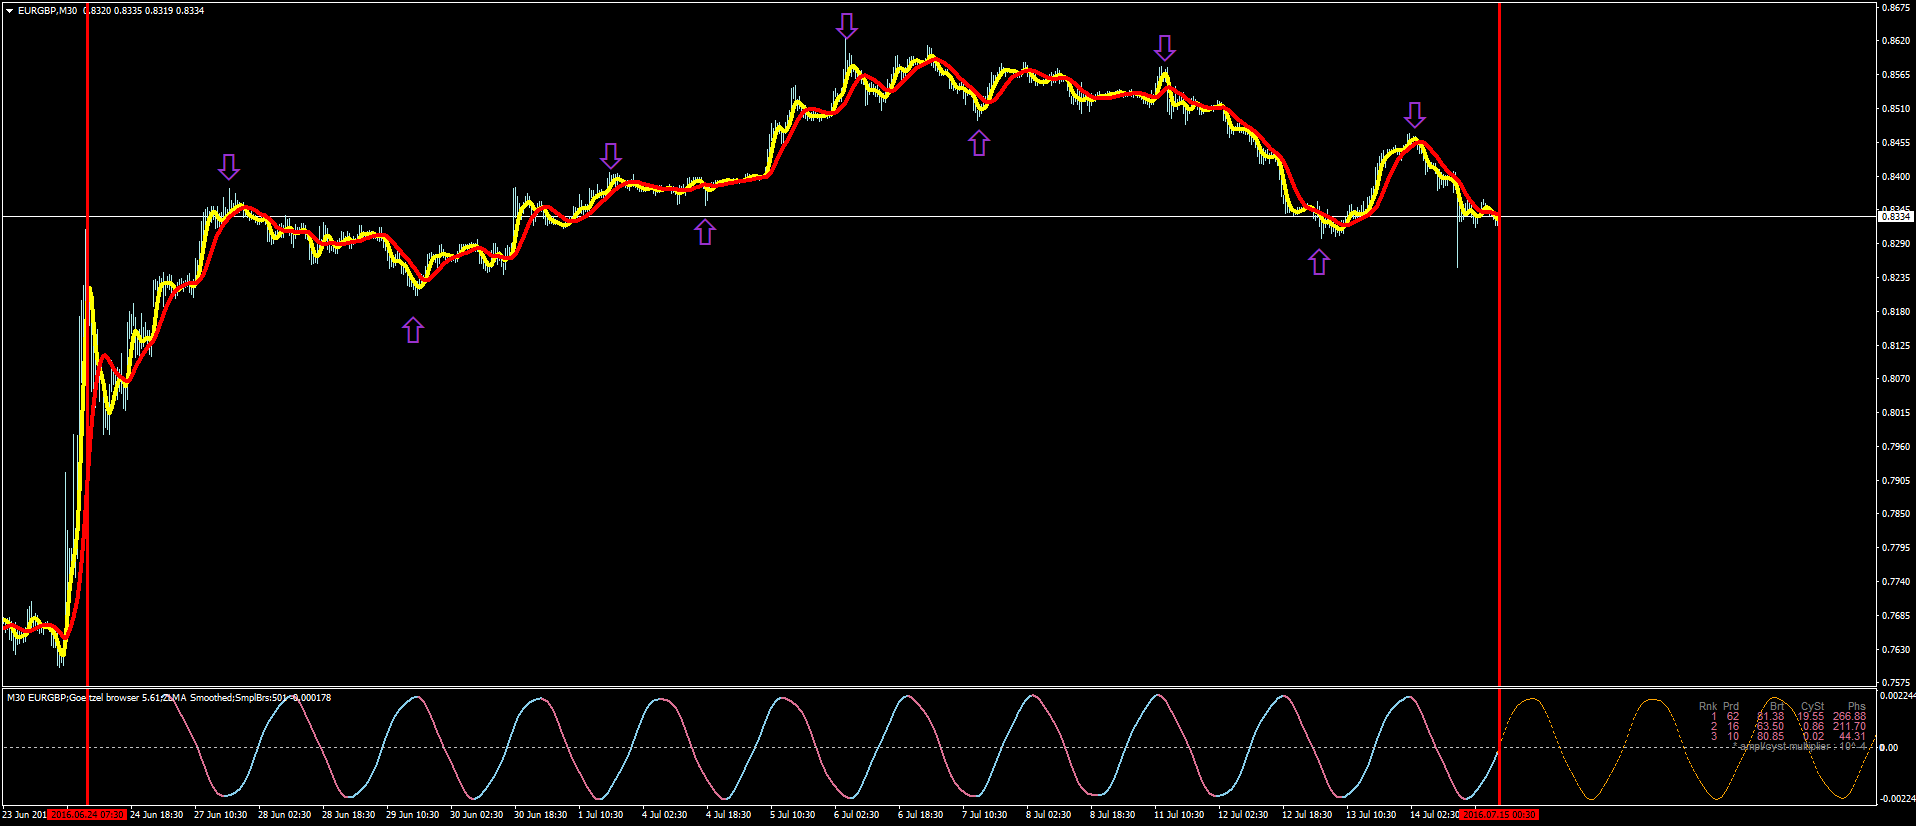
it's super easy , find tops & bottoms of market yourself . measure the number of bars between them . then set the max num cycle of indicator based on that . in the following example market trends never lasted more than 100 cycle so ! can u see the difference ? dominant cycle is right there , use it(or half) for tuning ur indicators , for example in the eurgbp m30 dominant cycle is 60 & i used 30 for super smoother(red). looks good to me ! another thing , u can use higher bartel test for cycles to remove some of them (more than 60 , default is 50).
eurgbp m30 before
gold m30 before :
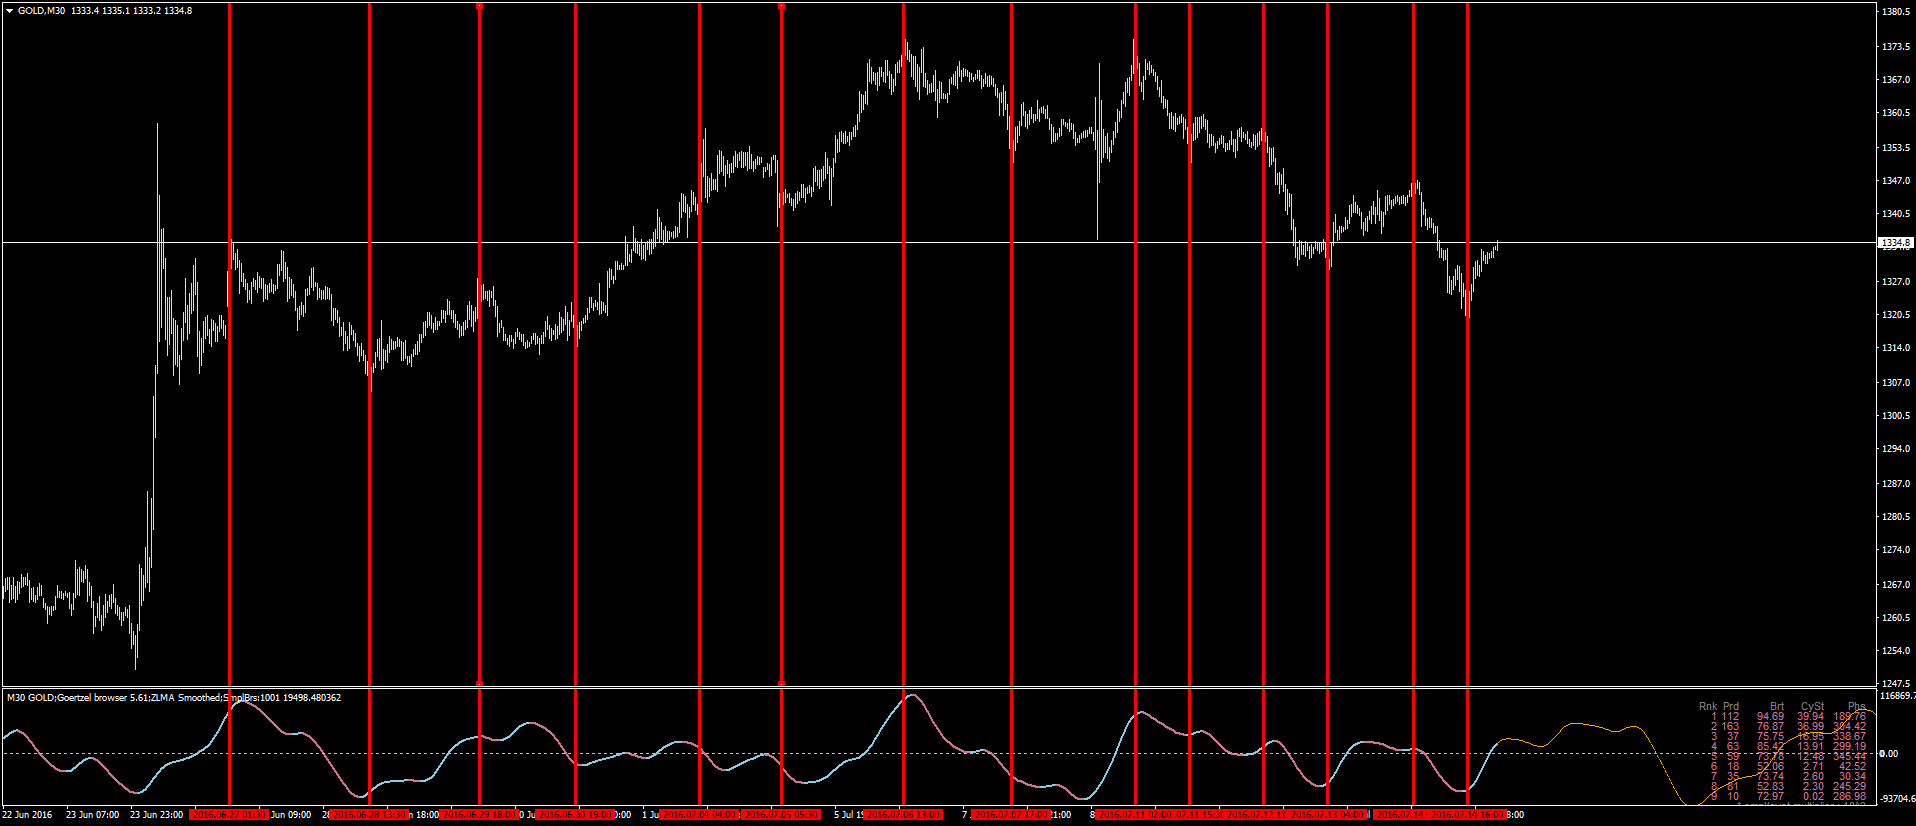
after :
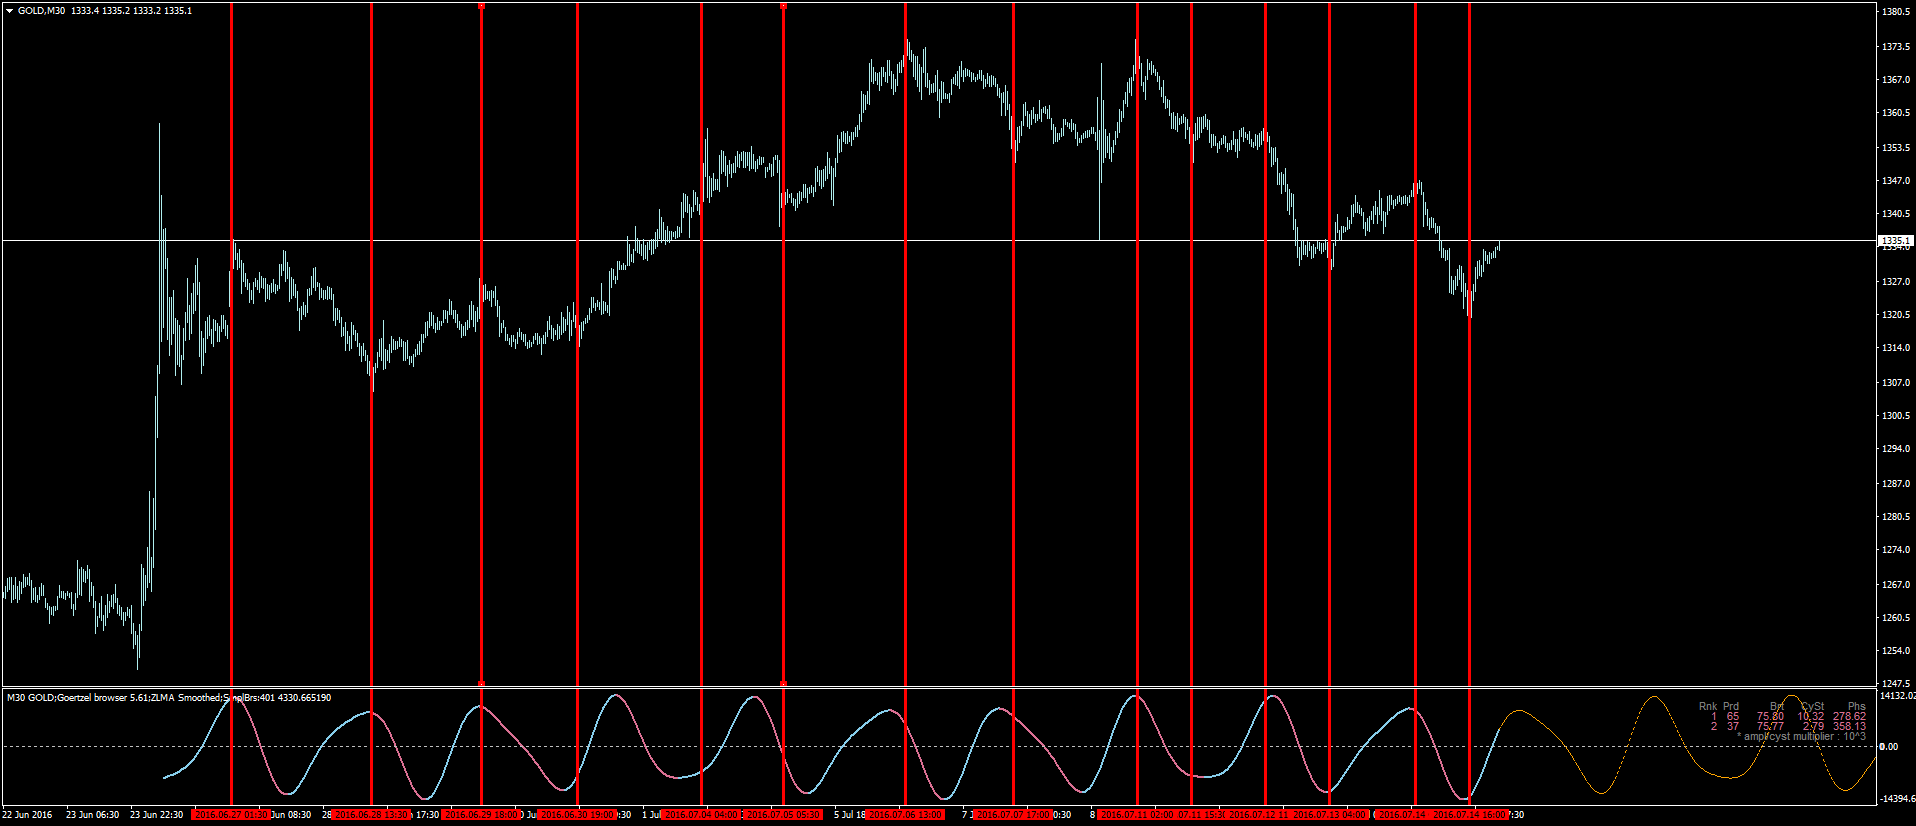
p.s: read cycles carefully , making a bottom doesn't mean buy opportunity !!
- Free trading apps
- Over 8,000 signals for copying
- Economic news for exploring financial markets
You agree to website policy and terms of use
i wanted to share my intraday trading system with u guys , so here it goes :
2 indicator is needed : one is supersmoother(or any filter with fast smooth response & low lag ) another one is regression analysis indicator (https://www.mql5.com/en/code/10249)
simply add 2 super smoother to chart with periods 10 & 20(*) , these 2 would give pretty much the momentum and trend direction based on close
add 2 regression with periods 40(*) & 80(*) , these 2 are necessary for finding the bigger picture ,market conditions () & range of cycles .
goal is finding a trend in higher time frame and best time to enter
* : u can find tune these periods with dominant cycle by goertzel or autocorrelation periodogram but dont change the 10 period supersmoother
________________________________________________________________________________________________________________________
example on oil :
1)open the H4
the 80period regression is sideway indicating sup/res at yellow boxes , but 40 period is bearish so we dont have a support but res at upper band . supersmoothers are inline with 40 period regression .
h1 chart :
h1 is pretty bearish too so maybe it's not really good idea to buy right away at support of reg80 h4 around 45$ . again h1 reg80 showing a possible sell setup at 48$ level (upper band)
m30 chart:
it is a great example , as u can see the 40 & 80 period regression are completely inline with each other but there's bullish sign from supersmoothers ! again price is somehow close to support of h4 . i think in this situations u should never buy unless you're a super experienced scalper . although price might go up but in my experience price would re test this levels again (it might break too) . one might enter the market with a sell (cause price is close to upper band of both regressions ) but it's matter of risk/reward ratio .
in this example best setups are sell@48 or @48.80 . for entry signals u can use reversal candle stick patterns or change in the slope of supersmoothers in m15 or m30 chart .