Using CCI to Make a Living Off Forex
Hi James,
I just arrived at the Forum to post a question about trading divergences on CCI, and then I noticed your post so I thought to post it here.
Elsewhere on the web I found a CCI strategy about trading divergences using CCI. I will repeat the info here, and then share my question:
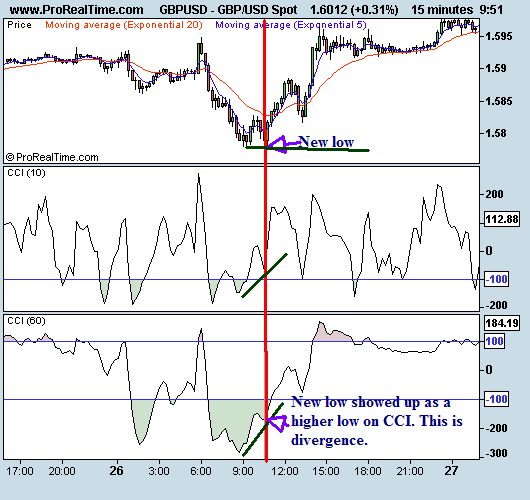
Divergence in a oscillator indicator (like CCI, Stochastics, RSI, RVI, WPR, ADX, MACD etc.) is basically where the price (in a uptredn) makes new highs but the oscillator indicator fails to make new highs. Similarly in a downward trend the price is making new lows but the indicator is failing to make new lows.
These divergence patterns potentially indicate that a reversal is about to take place because the trend is starting to run out of momentum, and divergences are often very strong reversal signals (but not every time).
So getting back to the CCI divergence trading system, it is recommended that you add two CCI indicators to a chart (add CCI Period 10 and CCI Period 60) because this will filter out a lot of false signals.
You want to wait for a divergence pattern to emerge on BOTH of these indicators. You can use just one indicator, but it is recommended to use both of them if you want to identify the very best signals.
See the image for a divergence example using cci 10, and cci 60.
I use a free cci divergence indicator that has a alert signal when there is a divergence setup (see mq4 attachment). The higher the timeframe the more accurate.
The cci divergence indicator has 3 adjustable settings (Fast EMA 12, Slow EMA 26, Signal SMA 9). These can be adjusted.
The regular MT4 CCI has only one setting (Period 14 default).
The above settings (12, 26, 9) in the CCI divergence indicator are very close to Period 10 in CCI.
My Question: What 3 settings (on the divergence cci with alert ) would I use to get CCI Period 60 or close to it?
This way I can add two divergence cci's to the chart and wait for both of them to show a trade signal at the same time.
That is a good question, but it seems the levels in the indicator can not be changed. If you know how to change them, then it is just a matter of trial and error. I have no idea how to make CCI levels equal to Macd levels. It is just a matter of inputting and seeing what you get.
How has your divergence trading been going by the way?
I just learned about divergence trading recently (I am very new to Forex). I am usually only able to trade the Asian session and it is often very slow. I hope to stay awake until the London open at some point and try some of the trading methods I am learning.
After studying about divergences it seems very reliable to trade them especially if there are other signs of a reversal when a divergence shows up (such as reversal candle patterns, and more then one oscillator showing a divergence etc.)
I wouldn't pay much attention to candle stick patterns or other indicators. You need to specialize all you can on one indicator such as CCI. Candle stick patterns are vague and in my opinion are not reliable. The market can not be forcasted by a few candles. However if you mean chart patterns, like head and shoulders or 3 drives, that another story.
First mistake you can do is go out and look at other indicators to add value to your trades. This will bring you down a never ending road of frustration where you will be looking for more sophisticated confirmations, when all you need is a simple strategy, such as CCI divergence trading with a good sense of money management.
I would add Fibs though to your divergence trading, maybe you will recognize some patterns that repeat themselves on a regular basis.
And since your missing alot of trading sessions, why not trade 4 hr timeframe? That should allow you enough time to have your trades open all day.
Thank you for the advice. I actually already added your cci strategy to a chart and will give it a try.
Oh cool, tell me if you need any clarification on charts. Just upload them and I can give you some pointers if its not clear what to do next.
Thx James the Giant for your system, i would like to have some charts example please, because 1 picture is a 1000 words... Max
Wow thx again James the Giant, keep posting your charts because it's help a lot, I will try to find set up... thx Max
Do we have a good set up to go long with this pair? Can you validate please...thx Max
- Free trading apps
- Over 8,000 signals for copying
- Economic news for exploring financial markets
You agree to website policy and terms of use
Advantage of this strategy over others:
1) Easy and obvious identification of trends and low momentum markets
2) No more over trading!
3) Quality trades with probability on your side!
4) Market strength analyzed by multi timeframes, USD strength, and correlations
5)Alerts on pair momentum so no more waiting in front of your screen
Rules of the strategy:
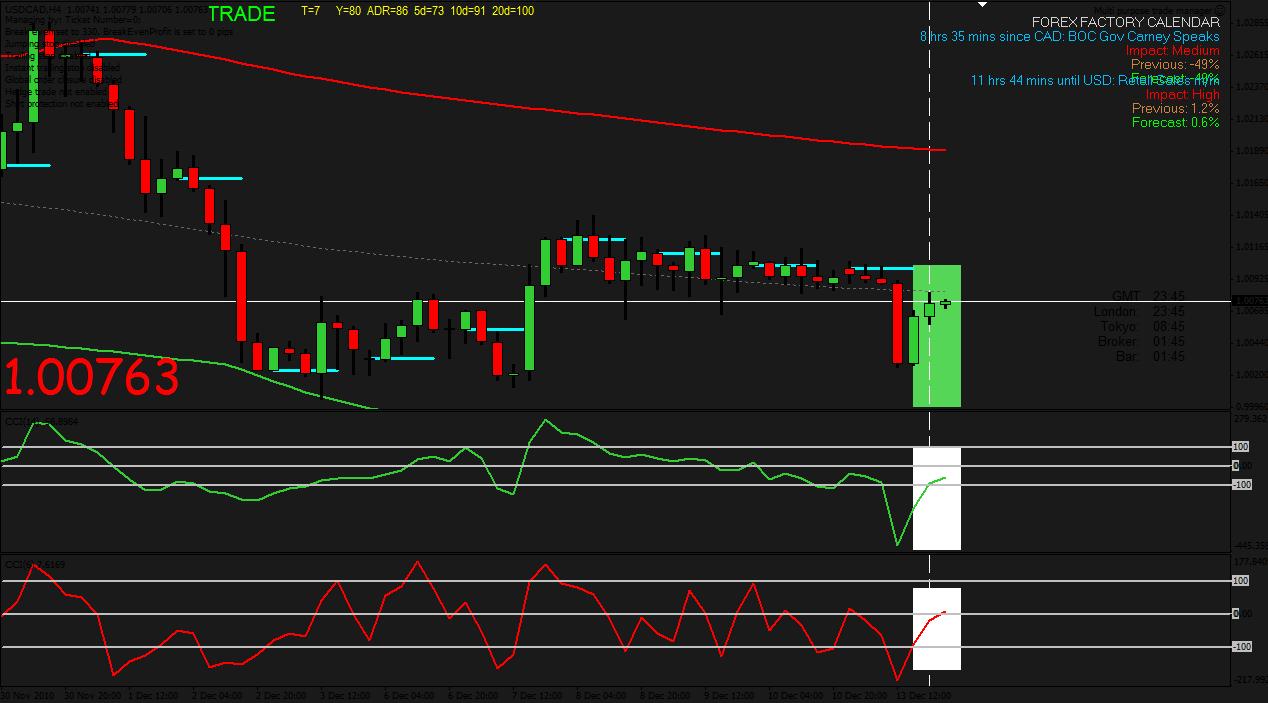
Attached are 4 indicators. Two are trend displays which show all timeframes on all correlated pairs for Non Lag MA and CCI periods of 25 and 50, ASI, which shows true market trendline breaks without spikes or false breakouts to confuse you, and the visible on chart non lag ma.
Settings for CCI Trend Display should be set to CCI 25 and 50 with current candle on True, unless you prefer for some reason to only see the strength of the previous candle. I like to see the realtime market strength and trade that, so I set it to current candle.
Settings for Non Lag Trend Display should be set to Length at 30 and PCT Filter at 0.25
The smaller period CCI of 8 and 14 were too small and didn't work well with the Non lag to filter out market moves.
The 30 Length Non lag along with the double CCI work much better and catch larger moves in the market filtering out many small ones that are not as trade able.
Both Trend Displays made by Altoronto.
This strategy is very visual which give all the information you need through arrows.
For a purchase order: Up Arrow on 15 Min-1 HR on both trend Displays on all pairs except USD CHF which should be all down
AU/USD- Up Arrow
NZD/USD Up Arrow
EU/USD Up Arrow
GU/USD Up Arrow
USD/CHF Down or UP Arrow across the board
Sell Order- USDCHF can be trending up or down with the other pairs, but has to be trending strongly, so all arrows follow direction across the board. (STOP LOSS IS 2 Times the Value of the 14 Period ATR)
(Trade in the direction of 4 HR)- If 4 HR is sideways, then don't trade that pair until its direction aligns with other pairs on 4 HR timeframe. Then you may take trades in that direction safely.
(Note: If most trend display arrows are up except 2 or 3 time frames across all pairs are sideways or down, then make the trade because the momentum is there. The other pairs will align. 2 or 3 unaligned arrows are allowed on both the CCI and Non Lag trend display.
Bonus- For the Trend line trader who wants extra confirmation
I have also attached the ASI indicator. It stands for Accumulative Swing Index.
This indicator is great for finding the true market level without the spikes, or false breakouts on any time frame. Only make trades in the 4 hr main trend, and you can even wait for multi pair trend line breaks to make a trade on smaller timeframes. Dont go crazy drawing trendlines, just focus on the immediate S/R, such as possible point on where the pair might revers, a trendline break for confirmation, and a trendline for following the pair in trend. And confirm the trendline break or bounce of s/r level by the multi pair correlated Non Lag MA and CCI trend displays.