Tick tools
Thanks a lot.
I updated
- this 'what's up' thread What is new in public in elite weekly,
- elite indicators links thread Elite indicators links thread
and
- links thread usefull links/threads/tools.
By the way it will be very interesting to see some scalping EA based on those indicators.
Thanks Igorad, you make very useful quality indicators, thank you for sharing them. 
Super igorad. Thanks.
Volatility Indicator (using ticks)
Hi guys
Anyone can code this Tick Volatility indicator or have something similar around? The description and link to the website is below.
The way to do this is to use our free Volatility Indicator. This indicator looks at the movement of each tick of the price and counts them. If we get say 5 ticks of movement within 1 second we know that the prices is about to move quickly in one direction or the other. The indicator will draw an arrow underneath the bar to show you that the volatility has dramatically picked up. Also an audio alert along with a message box will appear telling you that 5 ticks of the price have occurred within 1 second and that traders are entering the market right now. This is also the time you want to get in!
Thanks so much
Alvin
Hi guys
Anyone can code this Tick Volatility indicator or have something similar around? The description and link to the website is below.
The way to do this is to use our free Volatility Indicator. This indicator looks at the movement of each tick of the price and counts them. If we get say 5 ticks of movement within 1 second we know that the prices is about to move quickly in one direction or the other. The indicator will draw an arrow underneath the bar to show you that the volatility has dramatically picked up. Also an audio alert along with a message box will appear telling you that 5 ticks of the price have occurred within 1 second and that traders are entering the market right now. This is also the time you want to get in!
Thanks so much
AlvinBy the picture seems it's an screnshoot of MT4. If yes, indicator is already coded
Anyone can code this Tick Volatility indicator or have something similar around? The description and link to the website is below.
I think the link is missing, can you post it again?
I have started to develop new generation of tick tools with possibility to group bars from any number of ticks (or seconds) as in other known trading platforms.
Notes:
Points : Aqua - Close , Red - Open;
Also you should use corresponding color for 2nd buffer according to your background color (ex. Black for Black backgorund, White for White and so on).
Tick-and-Time-o-gram?
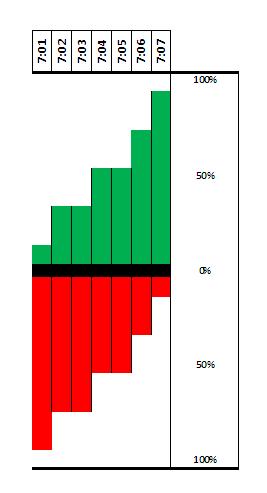
Price rises and falls so much in each candle (or bar), and once a bar closes, its "journey" from Open to Close via High and Low is lost visually. Can someone here make an indicator that shows what % of 100% of a candle's total time the tick price was above the Open price, and what % of 100% of a candle's total time the tick price was below the Open price? (Forgive me if an indicator for this is posted in the regular or Elite forum. I tried looking for it before posting here.)
The first attached fle is the Wick-O-Gram indicator, to give you an idea of how this new indicator should look. The second attached file (.jpg) is my crude attempt to show what this new indicator might look like if it were on a 1-minute chart, from 7:01 to 7:07. (I used rounded % numbers, but the real indicator should be smoother, like the MACD or other histogram indicators).
Another interesting indicator (probably for only the 1-minute chart) would be a vertical bar (for each chart candle) that gets filled up from bottom to top with one (user-definable) layer of color assigned for each down-tick and one layer of color for each up-tick. This would capture each candle's tick history vertically (from bottom to top) and in two colors.
Thanks in advance for responses to this post, and for the absolutely PRICELESS info in the Forex-TSD forums.
- Free trading apps
- Over 8,000 signals for copying
- Economic news for exploring financial markets
You agree to website policy and terms of use
Hi,
Recently I've begun development of tick indicators.
Some of them you can see in this thread:
-TickSmoother
-TickPriceChannel
-TickMACD
-TickStochastic
Some of them can be implemented in EAs for better entries or for scalping.