Lomb Periodogram
Here's something interesting that I saw on the Wave59 website.
I realize that when it looks to good to be true...it probably is...but wanted to get input on this from others.
Description from Lomb Periodogram
The interesting thing here mentioned is:
- uneven sampled series
- no interpolation
See also interesting article attached.
Is this something we should look into and perhaps build?what are the indicators in the image?
or aree you asking someone to make those indicators?
He is asking if someone can code indicator.
Guys,
Working on it, but ...
____________________________
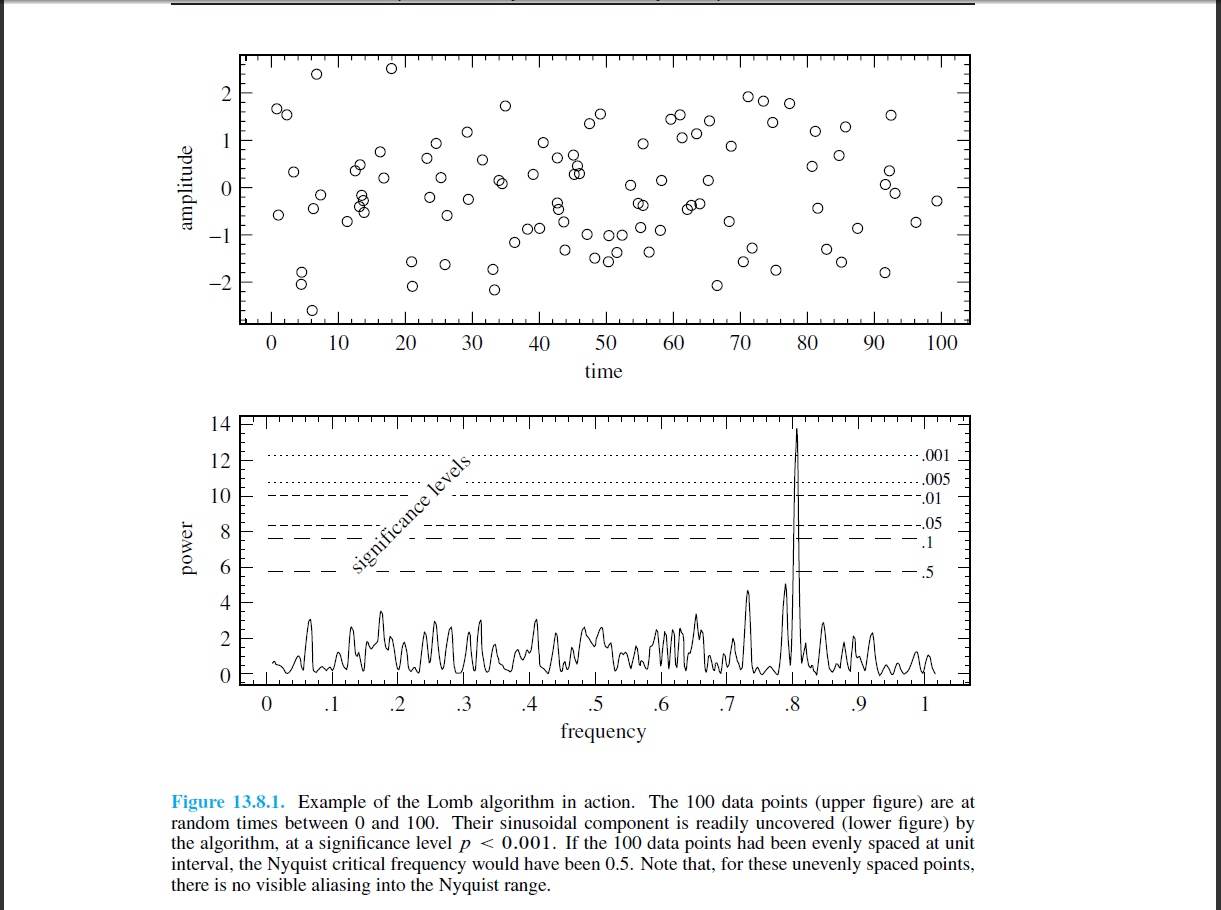
What is shown on those pictures is not Lomb periodogram itself (in the "raw state") The raw one looks something like this :and would look similar if you apply it to a time series (prices) too.
What I suppose they did is what already Dennis Meyers described as "End Point Fast Fourier Transform" - the simplified description would be that you take a window of data and scroll it along the observed data in order to get reading for each and every bar in our case. Applied to Lomb it would mean taking a maximum element of estimate of significance for every window of data calculated and draw it as indicator (at least I suppose so). Trying to figure out the whole mumbo-jumbo. If I succeed will post it here. If someone else does it before me, even better  ____________________________
The PS regarding the "but" at the beginning : Lomb periodogram is a subset of Fast Fourier Transform (it is a spectral analysis for unevenly sampled data) and without "windowing" or "end-pointing" it will repaint. Hence it must be done in order to make a usable indicator. To be frank so far I have not figured out 100% exactly what Meyers was proposing (from his descriptions and from my observations, it is far away from simplified interpretations some people are presenting as "end pointing"), so that is my first step. If I can figure out that, the rest will come ...
The "real PS" : please do not take this post as a promise. All I can "promise" is that if I make it I will post it here
Hi mladen,
I knew there had to be a 'catch' somewhere....! 
Anyway, it was not a request for a new indicator, more an initial idea to perhaps investigate the validity and feasibility of such indicator (i.e. will it really add some value over exisiting methods?) and explore the method a bit deeper.
Thank you for your elaborate explanation. Not holding my breath here, but I hope we can get the problem solved....
Wow this would go damn well with Zup for picking the endpoints.
I am looking forward to using the indicator. I don't know if metatrader can do transforms tho.
This INDICATOR is very food
It's possibile to nave this INDICATOR ?...?..?..
It looks like it could be great if it can be build!
This is an indicator included in wave59. I have not used a recent version of the software so things might have changed. At the time I was trading E-mini's but honestly the software was not that useful to me for day trading although some of the ideas presented were interesting. If you have a compatible data feed it might be worth checking out but it is not for me.
Alex
Anybody using this?
- Free trading apps
- Over 8,000 signals for copying
- Economic news for exploring financial markets
You agree to website policy and terms of use
Here's something interesting that I saw on the Wave59 website.
Modified Lomb Periodogram. The red oscillator reveals the relationship to the dominant market cycle. Wave59’s proprietary version is intelligent enough to know when it's confused. The green histogram indicates the level of error so you can trade with confidence.
I realize that when it looks to good to be true...it probably is...but wanted to get input on this from others.
Description from Lomb Periodogram
Traditional spectral estimators need irregularly sampled series, like the tachogram, to be interpolated and re-sampled evenly. The Lomb periodogram does not require interpolation and for this feature it has been proposed for the analysis of HRV signals (Laguna 1998). It also allows to examine frequencies higher than the mean Nyquist frequency, i.e., the Nyquist frequency one would obtain if the same number of data points were evenly sampled at the average sampling rate.
The method is based on the definition of the Discrete-time Fourier Transform, DFT, for unevenly sampled signals x(tn) (n=1, 2, ...N).
...and...
The Lomb Periodogram weights the data on a "per point" basis instead of on a "per time interval" basis. We assume that our data are the result of a deterministic component of an independent white Gaussian noise process.The interesting thing here mentioned is:
- uneven sampled series
- no interpolation
See also interesting article attached.
Is this something we should look into and perhaps build?