Various
Hello mladen,
thank you for the indicator. I see, the HP indicator repaints the past. I tried to ignore this and trying the implement an simple EA. I'm not sure, if this is reasonable.
If i use the Null-Line-Cross, the signal is mostly too late. If i use the color changing, the signal would often repaintet/false.
Greetings
Hello Mandrox,
You are right : it repaints (or recalculates, or whatever name we use for that) There were a couple of reasons why I decided to post the "wonder" indicator here :- it was a big, big fuss about it in the public thread. Those posts were deleted, so no traces were left but in order to keep the members of the advanced elite section informed, this indicator is posted so that all of you can know what was that all about. "Better to know than to guess ..." logic. I got my share of PMs asking for it, I know that teresh2 and leledc got the same and I guess that even now, some are trying to get hold of it_________________________
- the indicator posted here should help you avoid looking for it (in my experience people tend to think that what they do not have is some kind of a magic - this way you have it, you know what is it about and you can save some time and eventually money)
- as far as I am concerned it should not be used for trading. It might be used for some "visual testing" which, from time to time steps on cycles and than it can give us an impression as of "what is going on". It is, if someone would use it in a "signal manner" unreliable (as you have noticed it)
Also, it should not be used from an EA - it will give false results in back test and will not give reliable results in forward testing (it will depend on a luck, and sometimes it will seem that it is doing "its job" while the only thing would be pure luck)
I hope this post clarifies why the indicator was posted here. Compare it to T3 version posted in the elite section (this one : https://www.mql5.com/en/forum/general ) and you will find out that the T3 version is much more reliable - no repainting, and if you intend to use it for signal trading, even though it has the "usual illnesses" (lag), it is usable
PS: just in case that someone of you is not an elite member, re-posting the MACD T3 here too
regards
mladen
Hello mladen,
thank you for the indicator. I see, the HP indicator repaints the past. I tried to ignore this and trying the implement an simple EA. I'm not sure, if this is reasonable.
If i use the Null-Line-Cross, the signal is mostly too late. If i use the color changing, the signal would often repaintet/false.
GreetingsHello mladen,
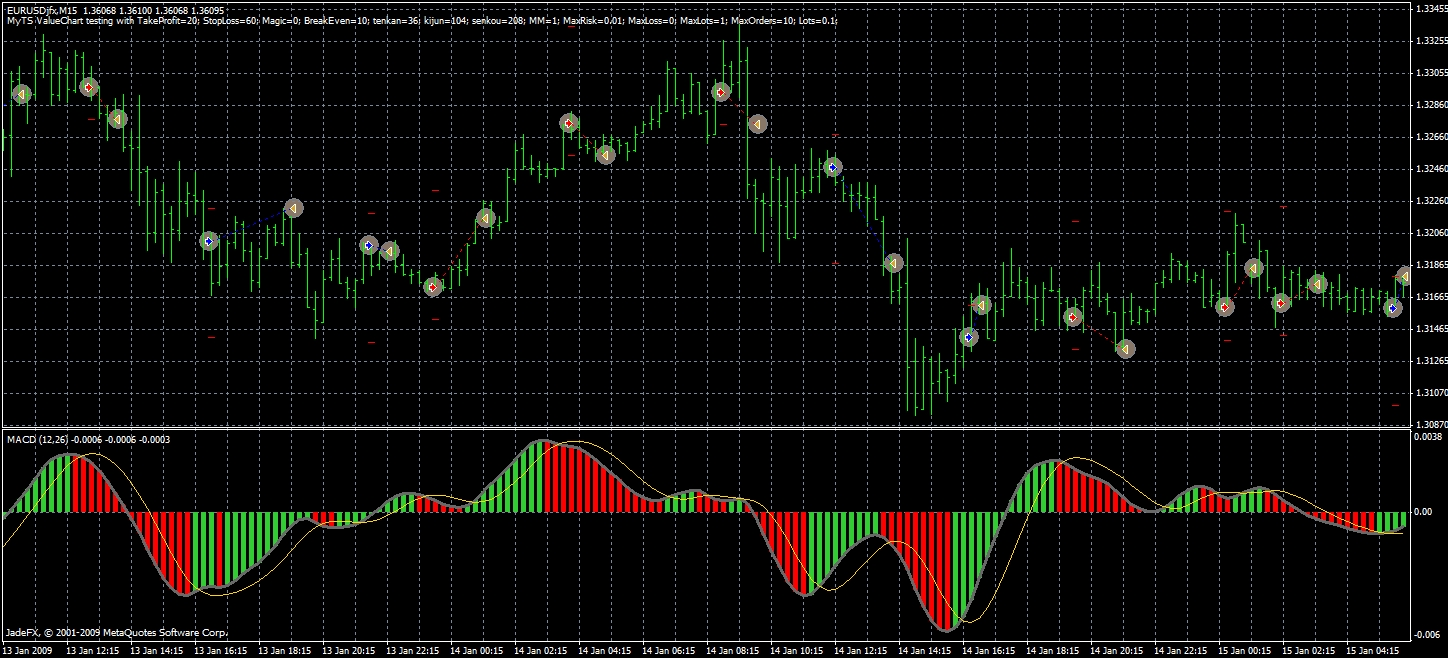
thank you for your reply and thanks for informatin, that the HP indicator shouldn't work, so i dont waste any time for an "magic" indicator :-)
I've tried the MACD T3 indicator, in the chart are the entries(from backtest). Please ignore the exists, they are not intelligent. Maybe, the indicator could help, maybe not.
Greetings
In "poking mood" these days
_______________________________
A short "forward" : igorad has, by his work on "Jurik filter", given us something of a great value. Finally it was not an indicator based on a decompiled code from Wealth lab, but an original work. But there were some things that were bugging me...
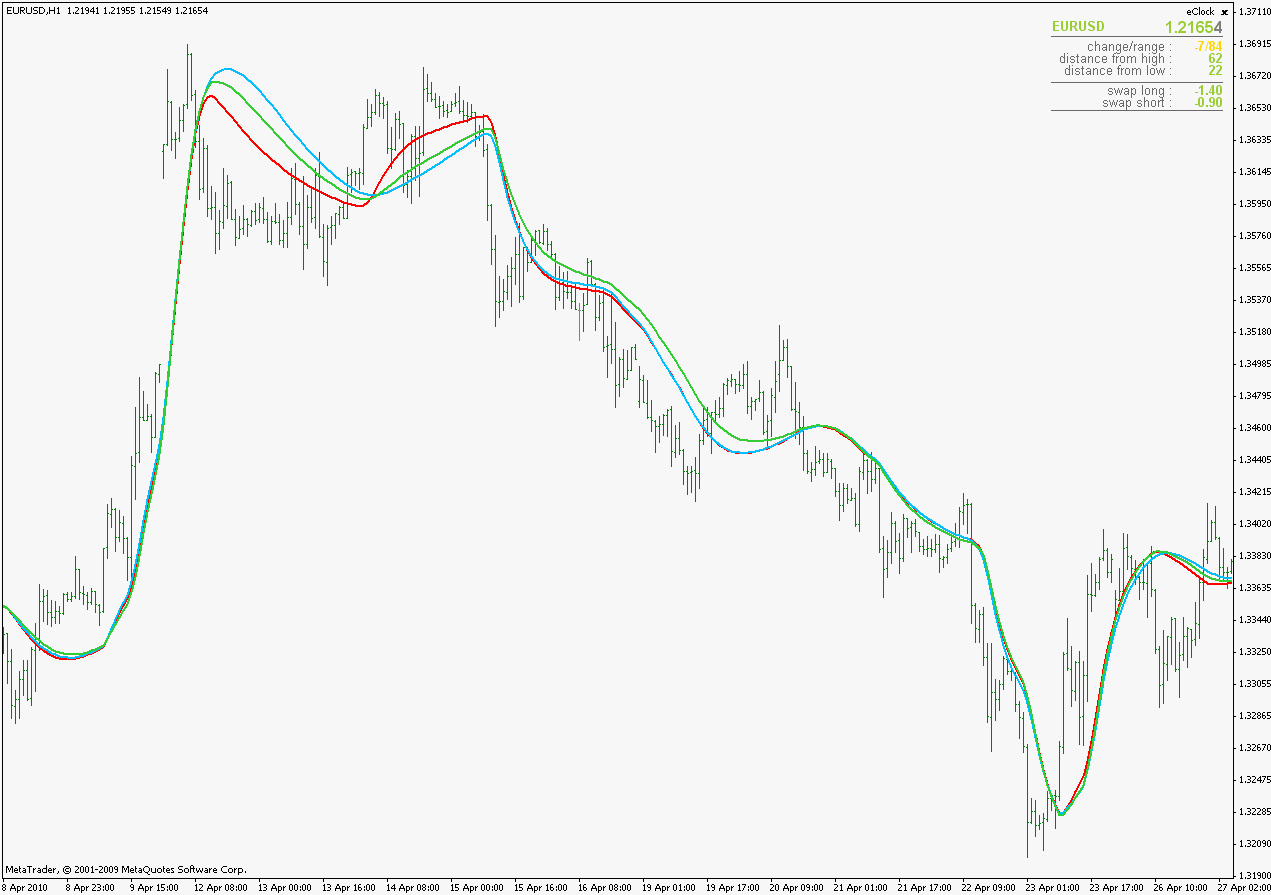
When comparing adaptive indicators (and JMA is adaptive) comparison should be done on a longer periods. Comparing them on a short period is simply not good enough (even some "non adaptive" averages can give very similar results to results given by adaptive indicators on a short period - it simply does not have "time enough" to adapt properly) And then some differences emerged. Here is an example :Red is the JMA made after wealth lab decompiled code (coded by Nikolay Kositsin) and blue is igorads version. Period 50, phase 0. The issue is immediately visible. In some cases difference is significant. And that was bothering me. Not that I am a fan of JMA, but was curious why does it happen. So I made some changes. The changed version some of you are already using without knowing it (the jurik smoothed versions) It was a first attempt to remove that difference (it almost always happens after the gaps, but sometimes differences accumulate even in the calm periods) Here is a comparison of the 3. Additional green line is that version that was trying to remove that difference after the gaps (still period 50, phase 0).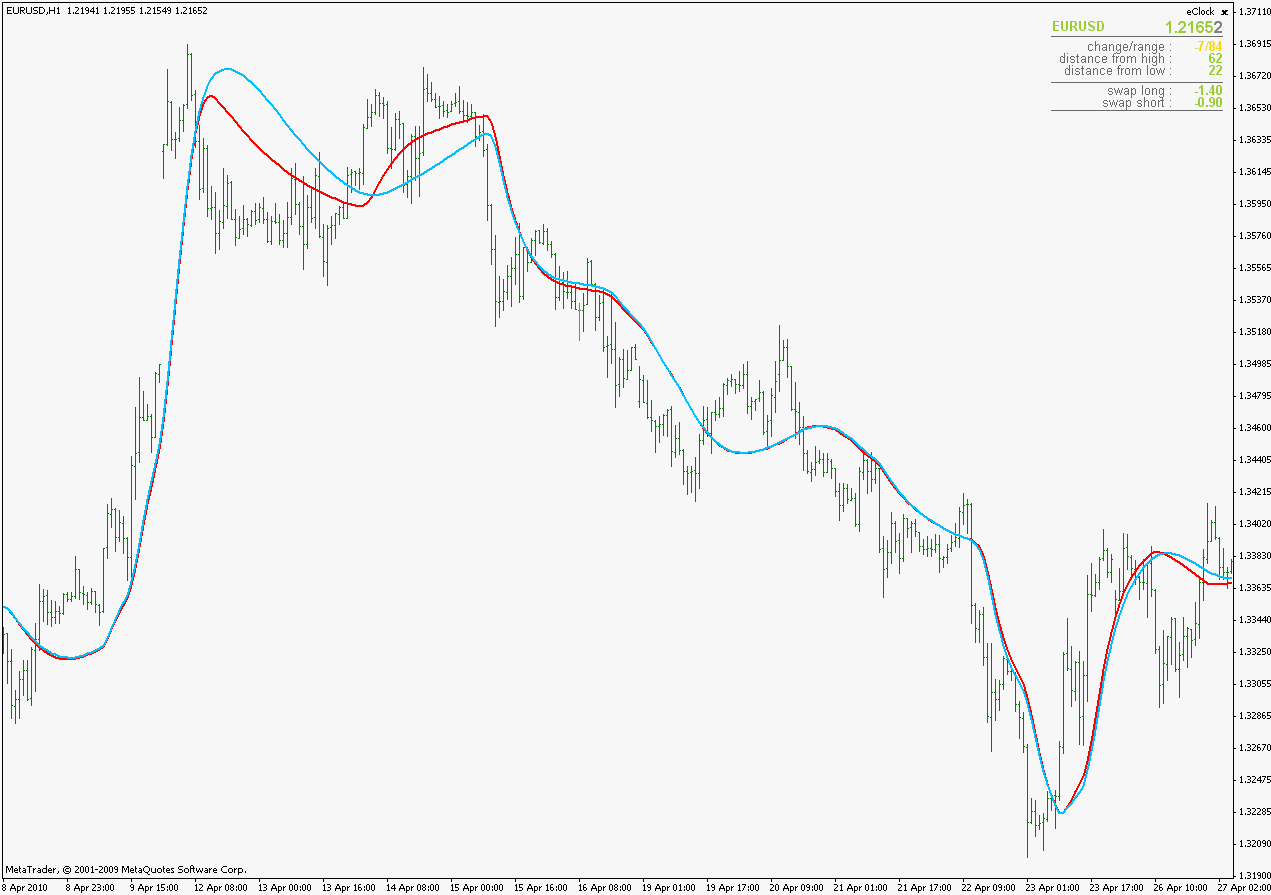
And still some issues
 _______________________________
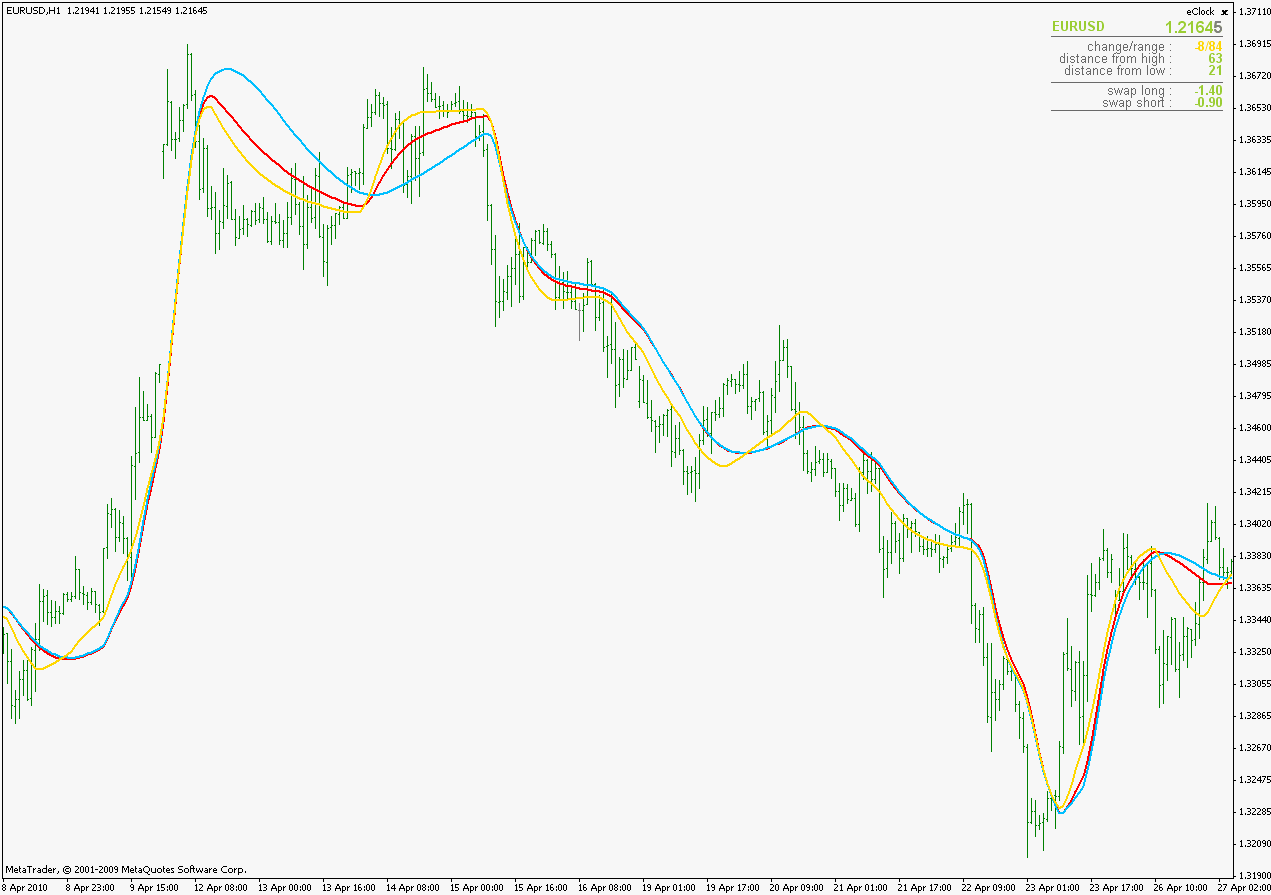
 Well, this is yet another version. The idea is to make even adapting adaptive. And the idea is, in the end, not to bother to much with JMA but to see what can be done in making a moving average that might be a bit faster than JMA but to preserve the smoothness and the response for sudden changes.
This is the result :The golden (:)) is the newest one. Still period 50, smooth 0. Differences do not happen just in periods like these (after the gaps), but in almost every sudden price change (an example with such fast changes)
_______________________________
At short periods they are almost the same but the differences start to show at longer periods. Tried to keep that relation since we do need smoothness at every period but we do need a fast response to reversals too on a long periods. The "1" in the name of the indicator is simply there because I am leaving this as an "open project" : if I come up with something that might improve it, will post it. The changes made are (at least I feel so) improving the indicator a bit and that is the reason why I am posting it at this stage too
...
This one is from the book a friend sent to me : "Evidence-Based Technical Analysis Applying the Scientific Method and Statistical Inference to Trading Signals" from David A Ronson.
_____________________________
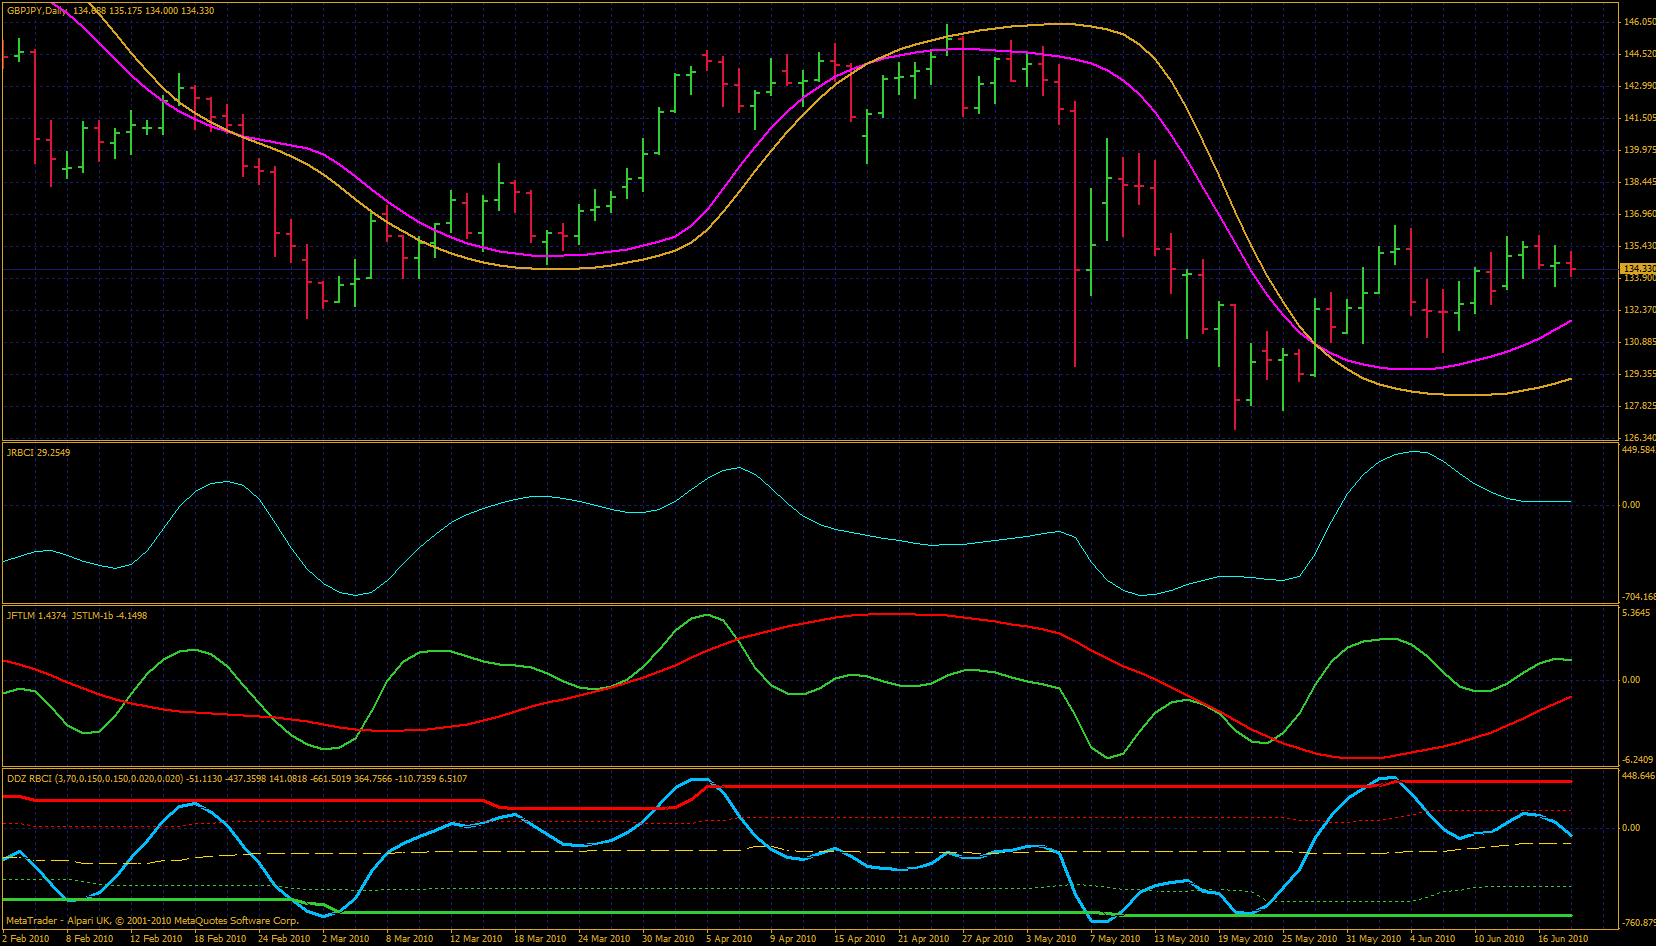
In one place (starting from page 430 ) the author is mentioning the use of stochastic (he calls it a "Channel normalization operator" but from a definition of it it is clear that it is what we usually refer to as "Stochastic") to detect divergences of two symbols. The idea itself is simple and that is why I like it : 2 stochastics of a smoothed price are calculated for the current symbol and for the symbol that is used to comparison. Then the difference of those 2 stochastics is calculated. The a further enhancement is done by one additional stochastic applied to this difference in order to get clearer and more usable values.Rules types would be the following :
And the description of the rules to trade :
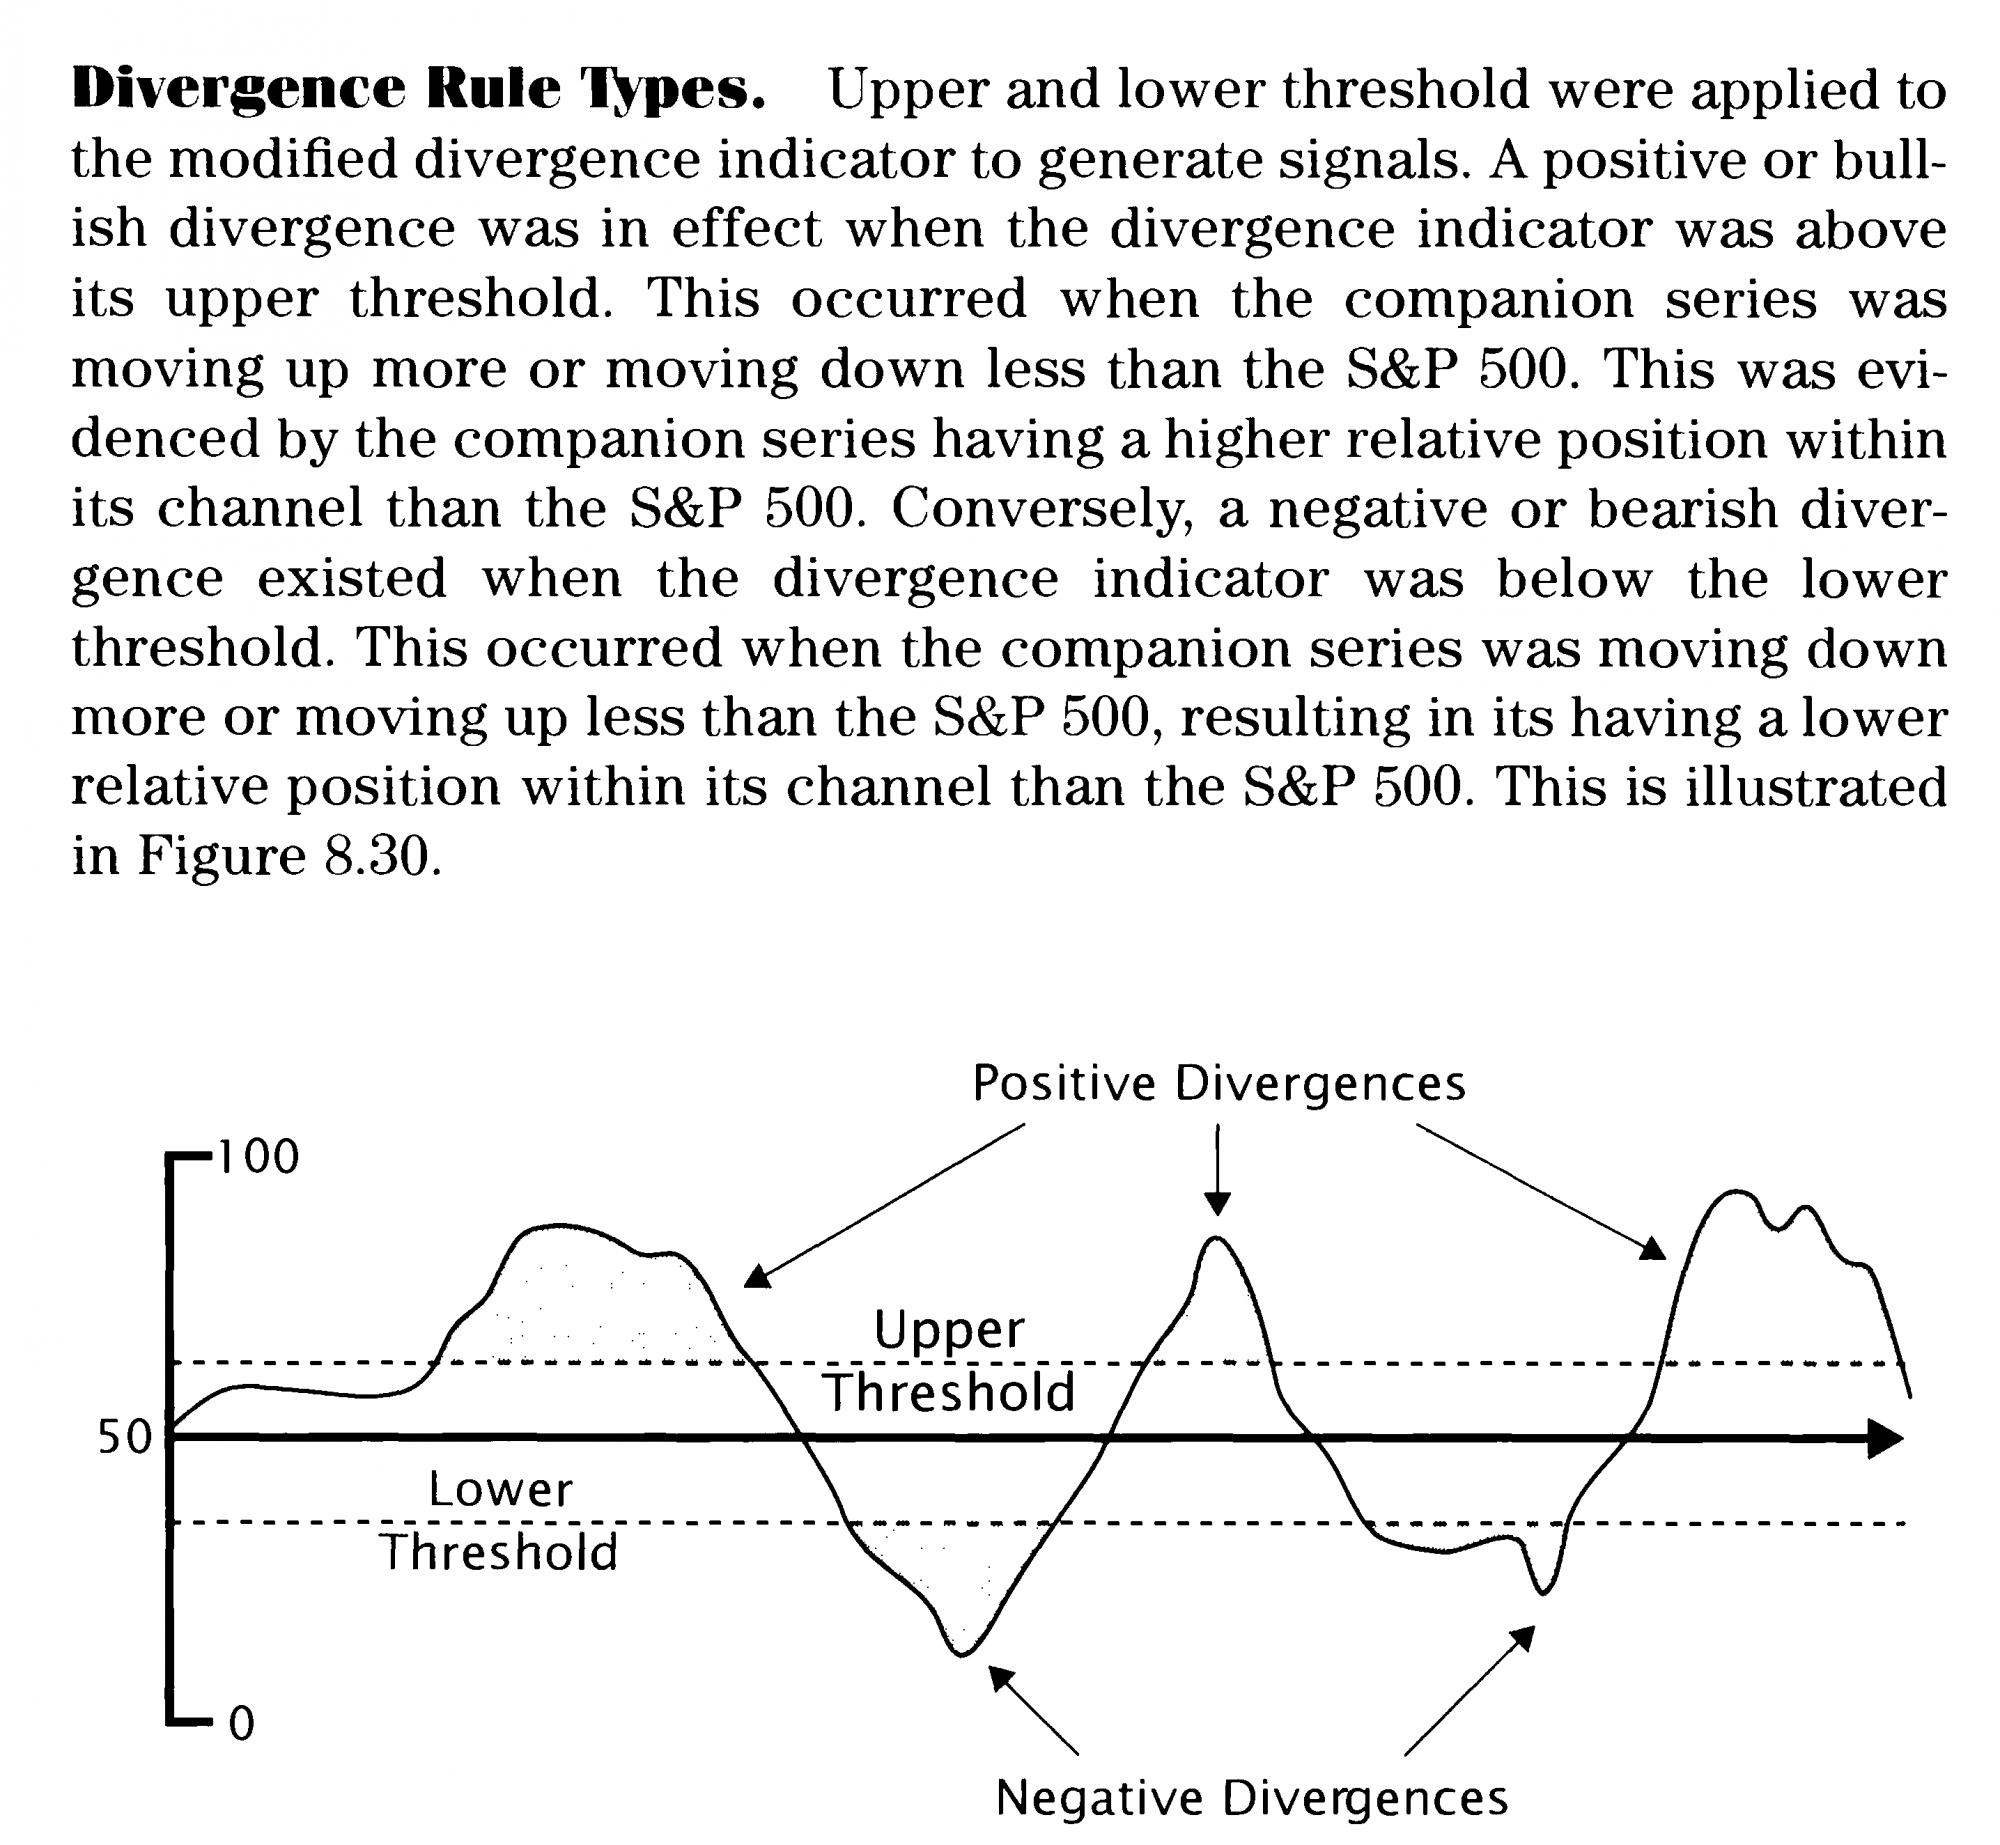
indicator was below its lower threshold.
Both rules assumed that the companion series had leading information about the S&P 500. If the companion series was stronger than the S&P 500 (positive divergence), then a long position would be justified, whereas if the companion series was weak (negative divergence) a short position would be justified. However, this assumption may be incorrect. It may be the case that negative divergences are predictive of higher prices for the S&P 500, whereas positive divergences are predictive of lower prices. In other words, perhaps it is the S&P 500 that has the leading information. This suggests that inverse versions of each rule should be tried. In the end, it was determined that there are 12 possible divergence rule types, and all were tested.
These 12 rule types are exactly the same set used for the extreme value and transition rules. This makes sense because the modified divergence indicator is similar to the indicator used for the E rules because it has a fluctuation range of 0 to 100 and has two thresholds. The 12 divergence rule types, presented in Table 8.4, include the basic bullish divergence (type 6), the bearish divergence (type 7) and their inversions (types 12 and 1). The 12 types are not illustrated because the illustrations would be redundant of those presented in the section on Extreme and Transition Rules.
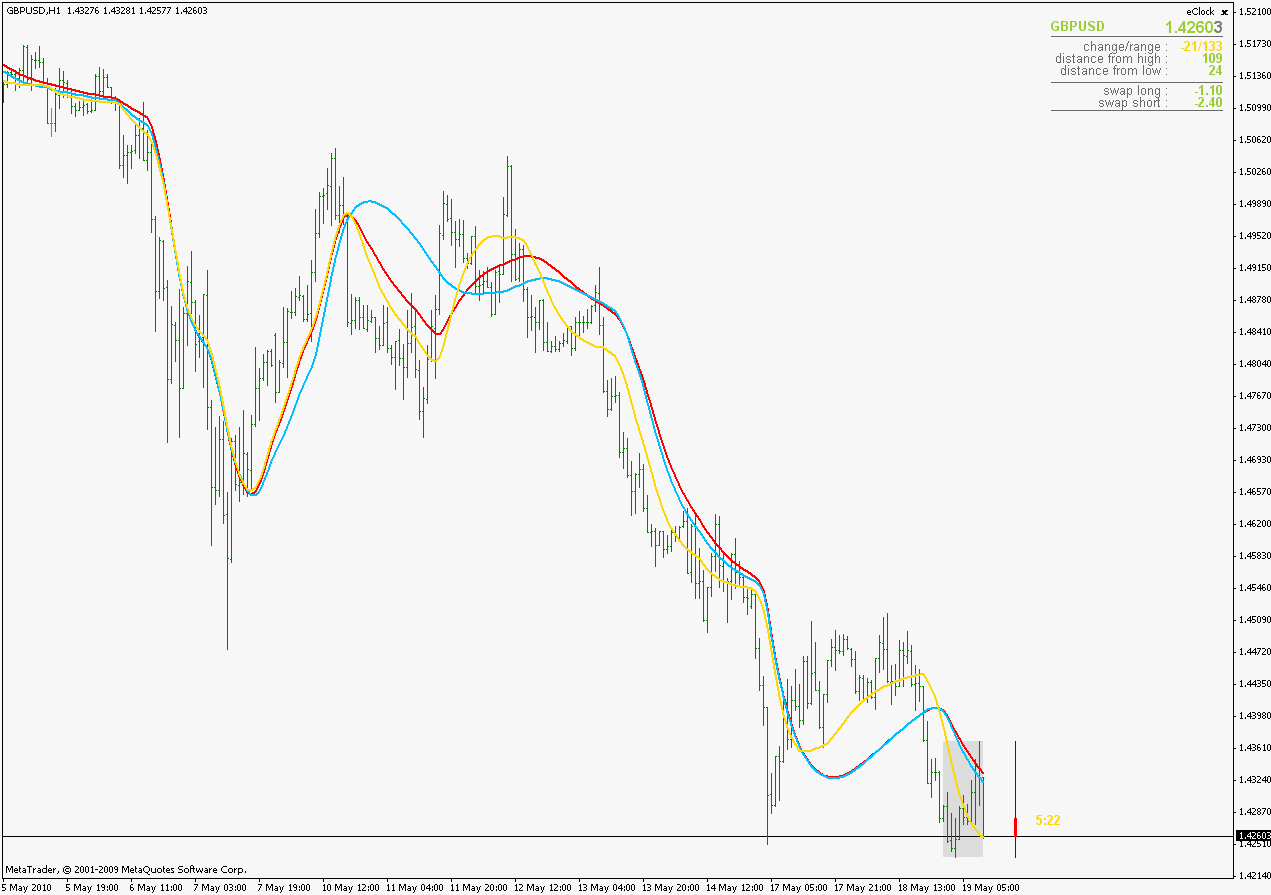
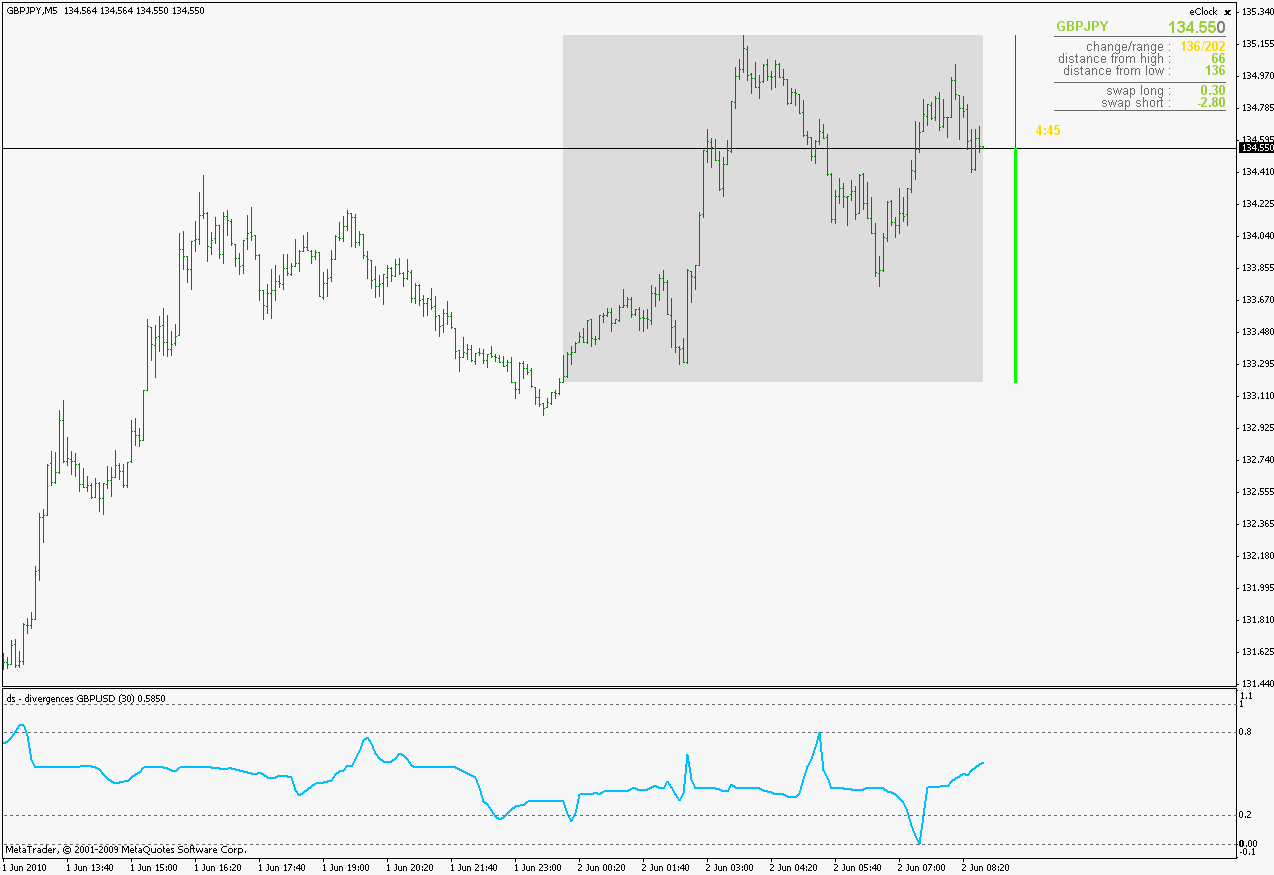
PS: author uses S&P 500 as base symbol but in my opinion we can use symbols we know are highly correlated (like the example on the picture GBPUSD used for base symbol on a GBPJPY chart) and in that case the indicator should give meaningful results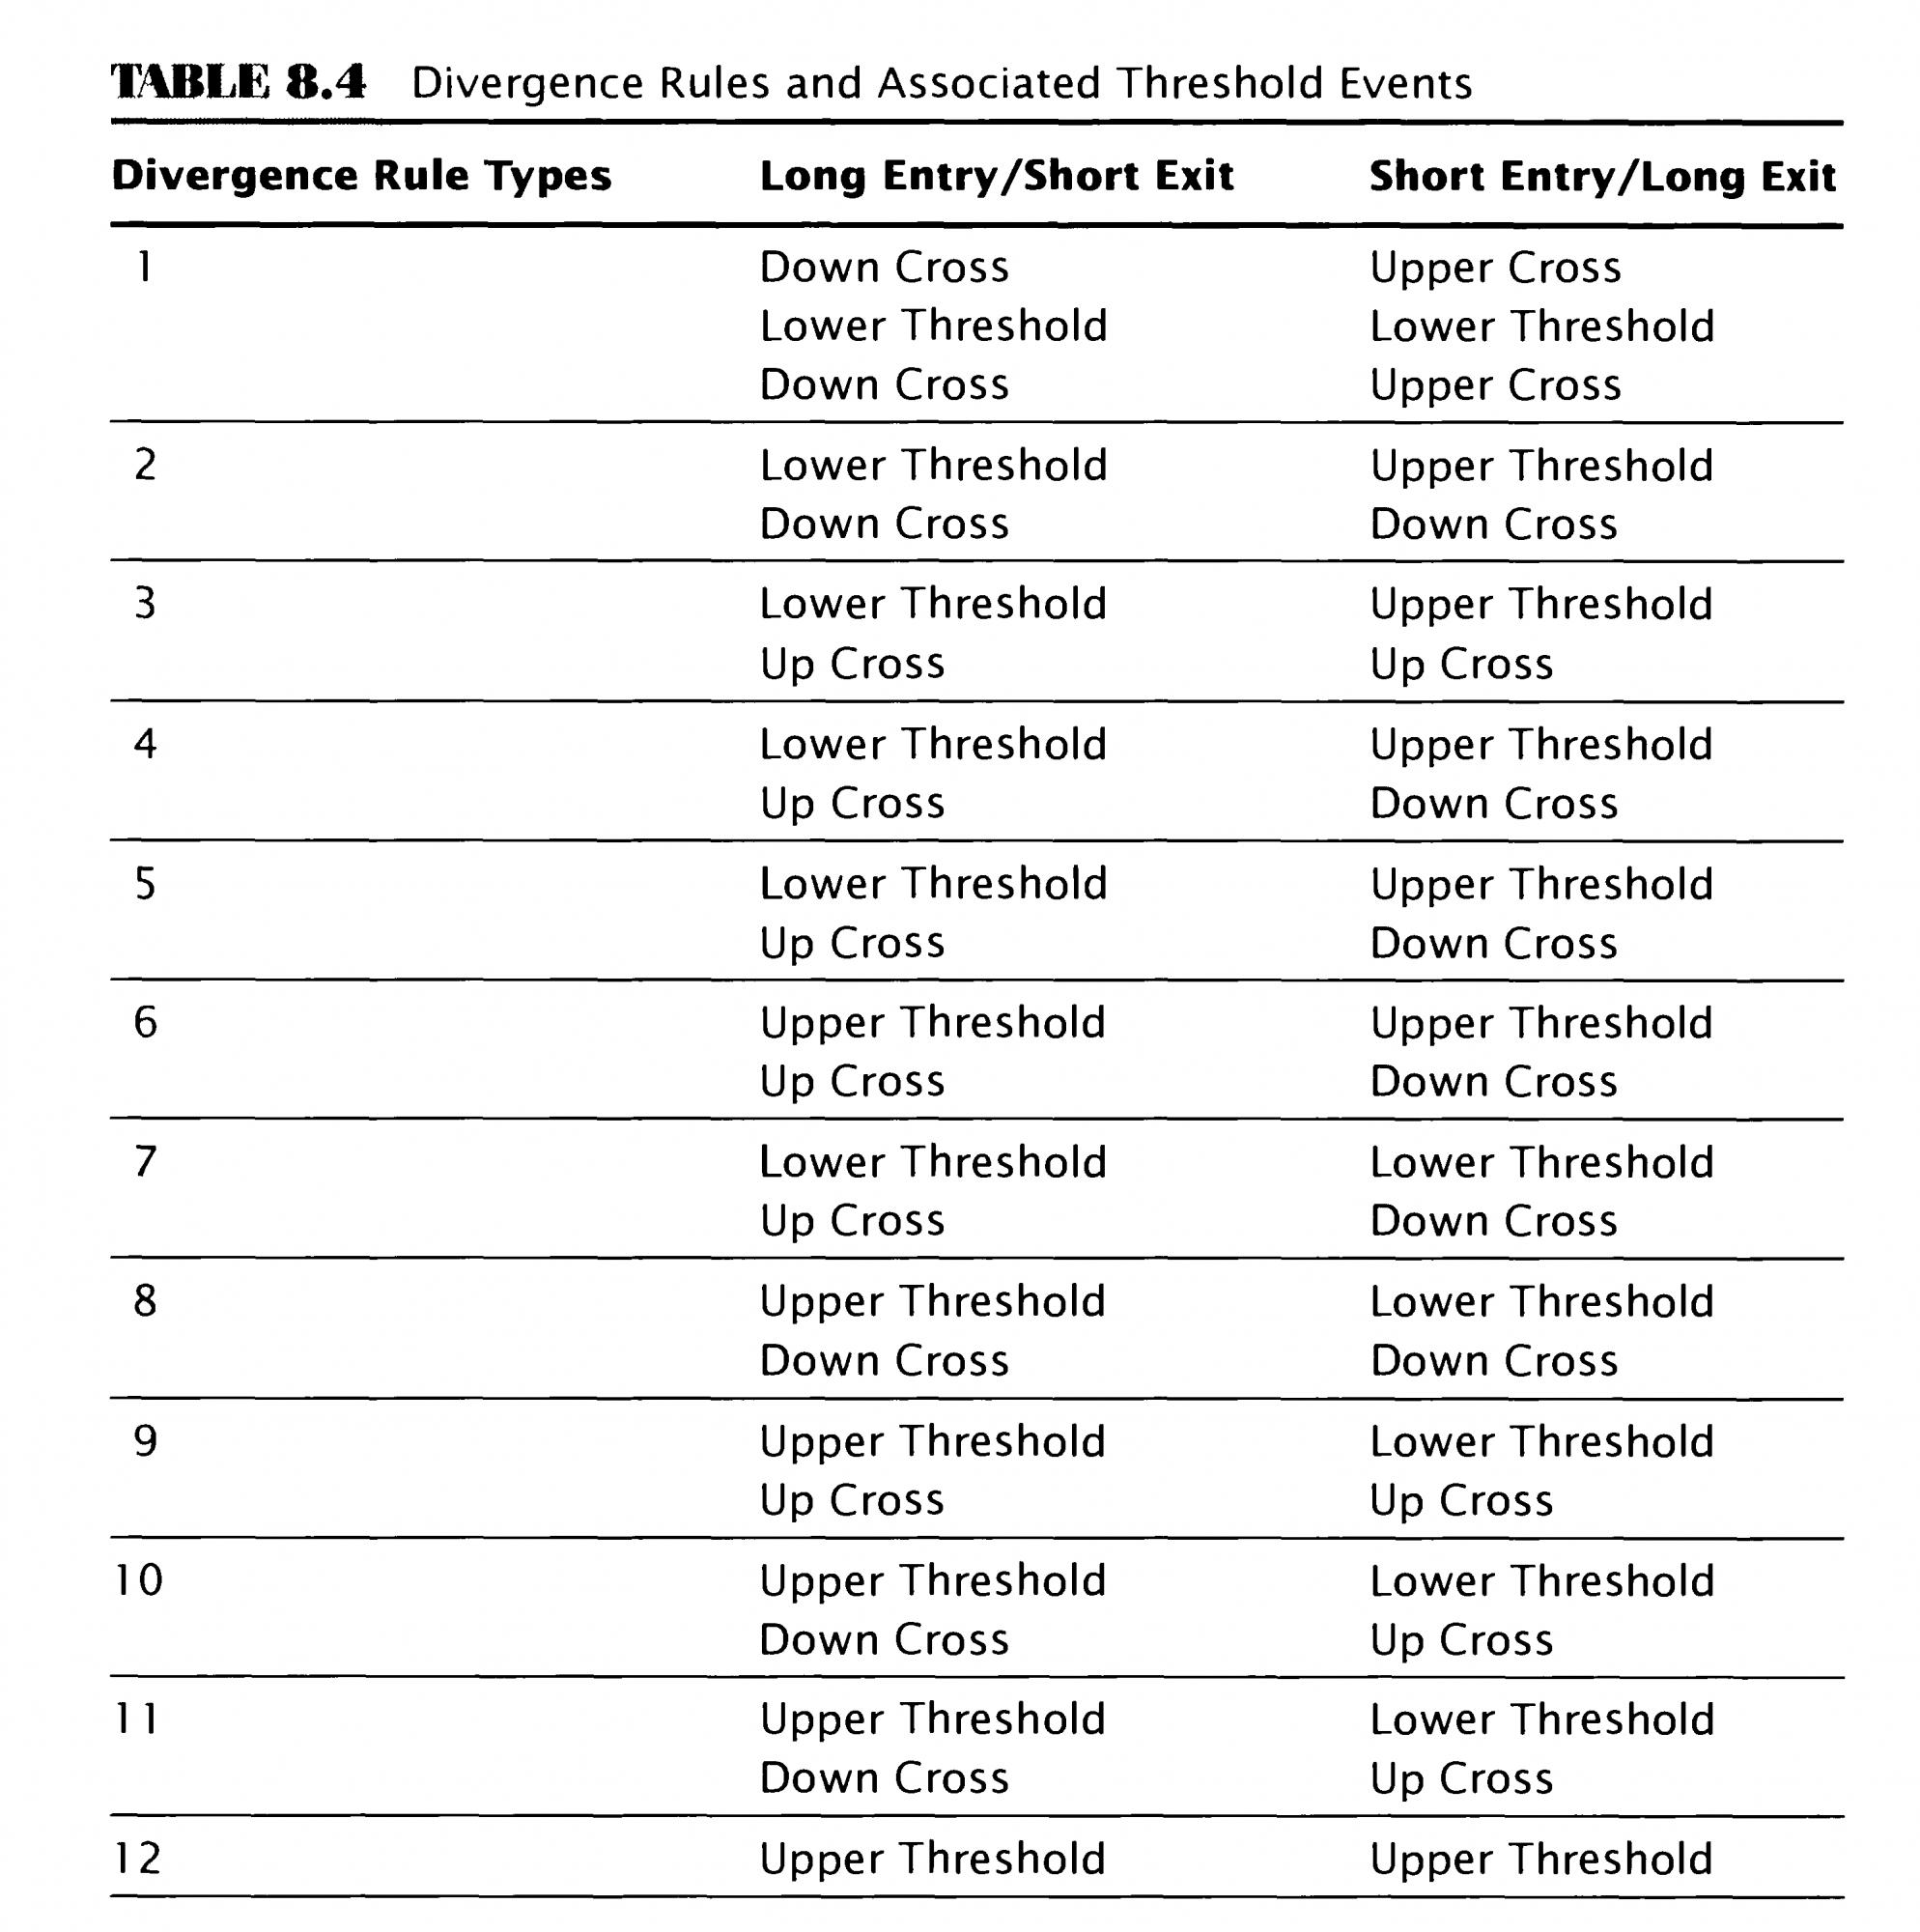
PPS: I decided not to draw the 50 line but instead to have something that could be called a "no divergence channel" in the middle of the indicator
In "poking mood" these days
_______________________________
A short "forward" : igorad has, by his work on "Jurik filter", given us something of a great value. Finally it was not an indicator based on a decompiled code from Wealth lab, but an original work. But there were some things that were bugging me...
When comparing adaptive indicators (and JMA is adaptive) comparison should be done on a longer periods. Comparing them on a short period is simply not good enough (even some "non adaptive" averages can give very similar results to results given by adaptive indicators on a short period - it simply does not have "time enough" to adapt properly) And then some differences emerged. Here is an example :Red is the JMA made after wealth lab decompiled code (coded by Nikolay Kositsin) and blue is igorads version. Period 50, phase 0. The issue is immediately visible. In some cases difference is significant. And that was bothering me. Not that I am a fan of JMA, but was curious why does it happen. So I made some changes. The changed version some of you are already using without knowing it (the jurik smoothed versions) It was a first attempt to remove that difference (it almost always happens after the gaps, but sometimes differences accumulate even in the calm periods) Here is a comparison of the 3. Additional green line is that version that was trying to remove that difference after the gaps (still period 50, phase 0).
And still some issues
_______________________________
Well, this is yet another version. The idea is to make even adapting adaptive. And the idea is, in the end, not to bother to much with JMA but to see what can be done in making a moving average that might be a bit faster than JMA but to preserve the smoothness and the response for sudden changes.
This is the result :The golden (:)) is the newest one. Still period 50, smooth 0. Differences do not happen just in periods like these (after the gaps), but in almost every sudden price change (an example with such fast changes)
_______________________________ At short periods they are almost the same but the differences start to show at longer periods. Tried to keep that relation since we do need smoothness at every period but we do need a fast response to reversals too on a long periods. The "1" in the name of the indicator is simply there because I am leaving this as an "open project" : if I come up with something that might improve it, will post it. The changes made are (at least I feel so) improving the indicator a bit and that is the reason why I am posting it at this stage too
Here's a mtf version of jurik filter simple. Picture of daily high low jurik on m15.
jurik digitals
Since the jurik was posted here guess will post these here, like these much better than the old versions that needed sometimes 4 or 5 usually not working right "include" files.
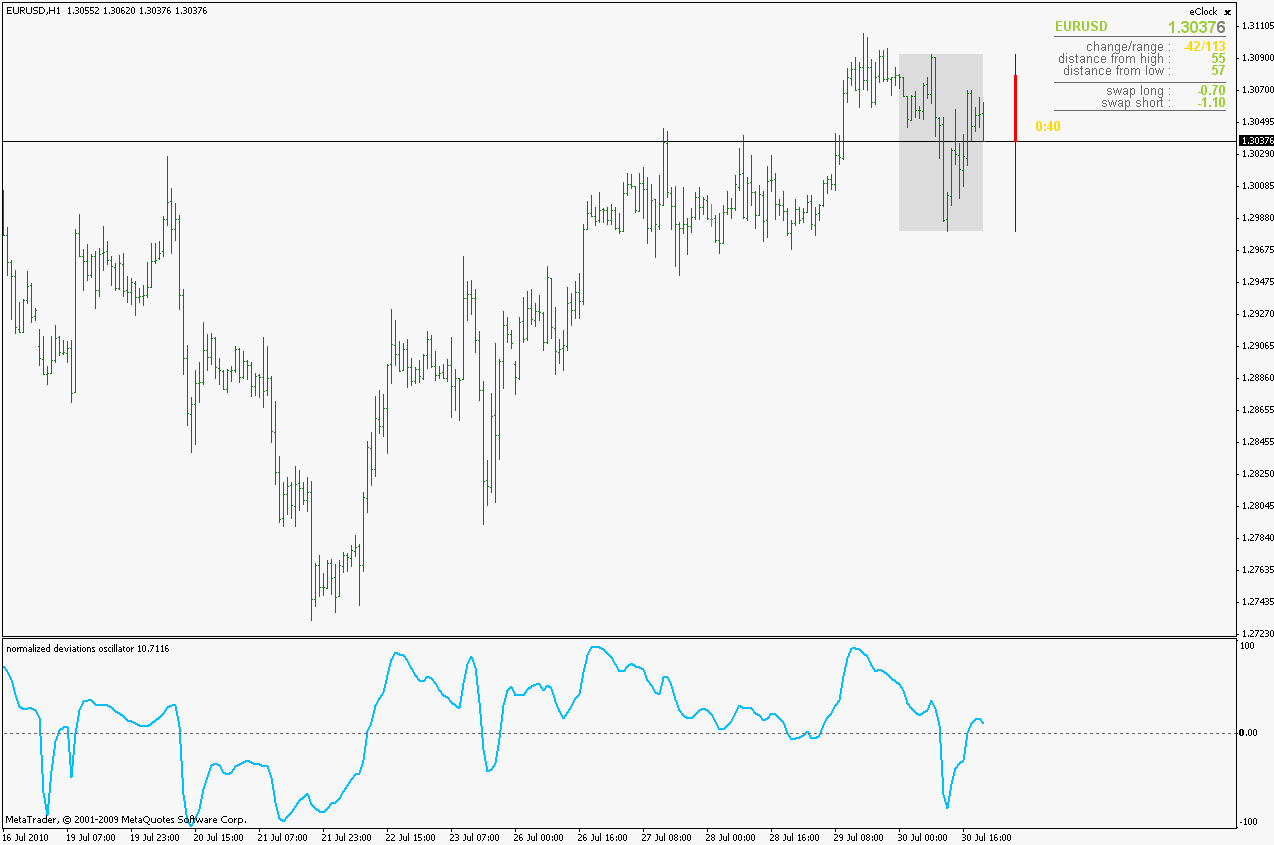
As usual, fooling around and then sometimes something useful comes out of it. Found an article about normalizing deviations and it caught my eye that if it was smoothed, it would be more useful.
So here it is :Non-smoothed(smooth period less than or equal to 1) :Smoothed :
- Free trading apps
- Over 8,000 signals for copying
- Economic news for exploring financial markets
You agree to website policy and terms of use
In case some of you have been wondering what was the "wonder" indicator picture posted a couple of times in the digital filters thread, and, since rules for advanced elite section are a bit different :
It was a MACD of a Hodrick-Prescott filter. One version of that indicator (Hodrick-Prescott filter) was already posted by me a couple of months ago in the elite section, but I am posting here a new version (faster, cleaner) along with my version of the MACD of Hodrick-Prescott filter. MACD does not need the Hodrick-Prescott filter indicator in order to operate____________________________Some additional info on how and what Hodrick-Prescott filter does can be found here : Hodrick-Prescott filter - Wikipedia, the free encyclopedia
____________________________
PS: unpack the dll from the "Hodrick-Prescott filter.zip" file to the experts/libraries folder (keep the name of it too in order to allow the indicators to work properly)
____________________________
PPS: there was a typo in the MACD HP filter indicator. If anybody does not see the indicator when it is loaded, please re-download the indicator or change the line that is saying "Hodric-Prescott filter.dll" to "Hodrick-Prescott filter.dll" Sorry people, my mistake Thanks MrTools for noticing