Sideways Market indicator
Hi all,
I am looking for some suggestions to find an indicator to help me prevent trading in sideways markets and prevent whipsaws. Any suggestions?
JHello Jluyt,
That's a good question, you ask 10 people that question you will probably get 10 different answers, and the one who has the answer is not telling 
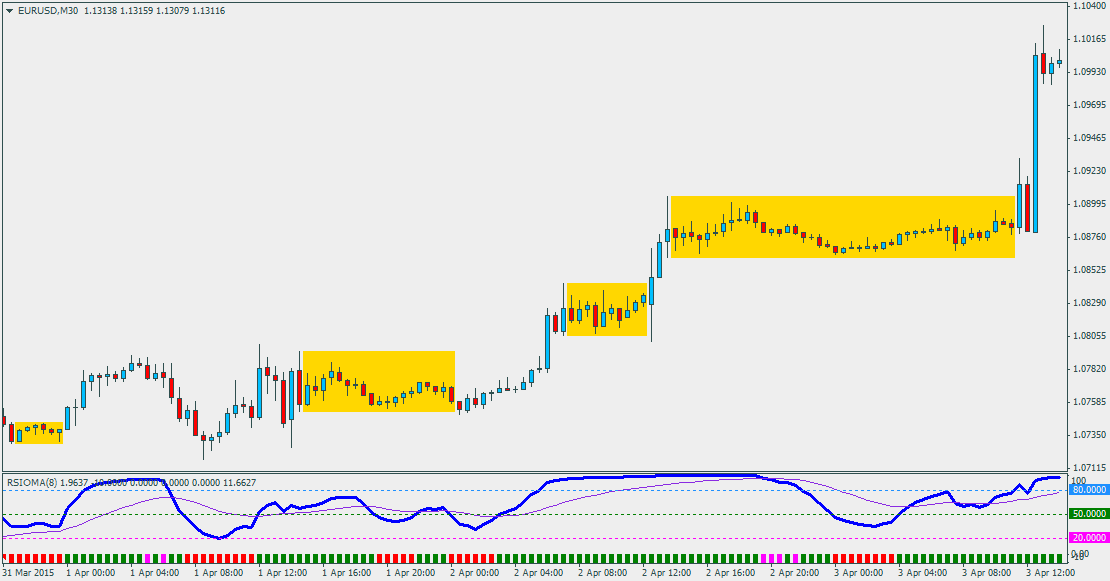
I would imagine this could be one way, just trade the dots.
Hello Jluyt,
That's a good question, you ask 10 people that question you will probably get 10 different answers, and the one who has the answer is not telling
...nice answer too Mrtools 
Thanks
I did heard another good sideway indicator is xpma period 34, no trade on the color yellow.
I need a side way detector indicator that will draw a two line like the one in the above picture, if trend beak the line up it means buy and if trend break the line down it means sell. Anybody please, help
Yes, it is difficult to understand when the market will flat.
By much trainning our eyes, we may understand.
Hello Jluyt,
That's a good question, you ask 10 people that question you will probably get 10 different answers, and the one who has the answer is not telling
Hi Mr Tools,
The Kaufman mq4 file is downloaded but will not 'take' on the chart.
Can you post again or help me in getting it to work?
Thanks
TEAMTRADER
Maybe Master Candle can also help. It's a price action pattern, after which very often a a nice trend takes place, not always the direction the first candle after is showing at - so, watch your momentum indicators.
atm_mastercandle_ib_pb.mq4 (chart should be in the foreground)
- Free trading apps
- Over 8,000 signals for copying
- Economic news for exploring financial markets
You agree to website policy and terms of use
Hi all,
I am looking for some suggestions to find an indicator to help me prevent trading in sideways markets and prevent whipsaws. Any suggestions?
J