Triangular moving average - centered ...
In order t avoid that missing data, people have found out that it might be extrapolated (the missing data) and that is what is usually used as centered triangular moving average : TMA that is shifted by half length to the left and the missing data is extrapolated in a certain way. Here is how the usual centered TMA looks like :
The gap from the right is filled in and it all looks just fine. Except that there is no 100% exact way of extrapolating data. So, that extrapolated gap is a subject of changes no matter what extrapolation method one uses (otherwise I would be drinking coffee with Warren Buffett in the morning and not in my kitchen). There is no way to make it non-changeable (non-repainting). None ... So much about the wonders of centered triangular moving averages : it is a good tool for estimation, but in no way should it be used in "signaling" mode since the signals are going t change
Triangular moving average ...
First the good old triangular moving average.
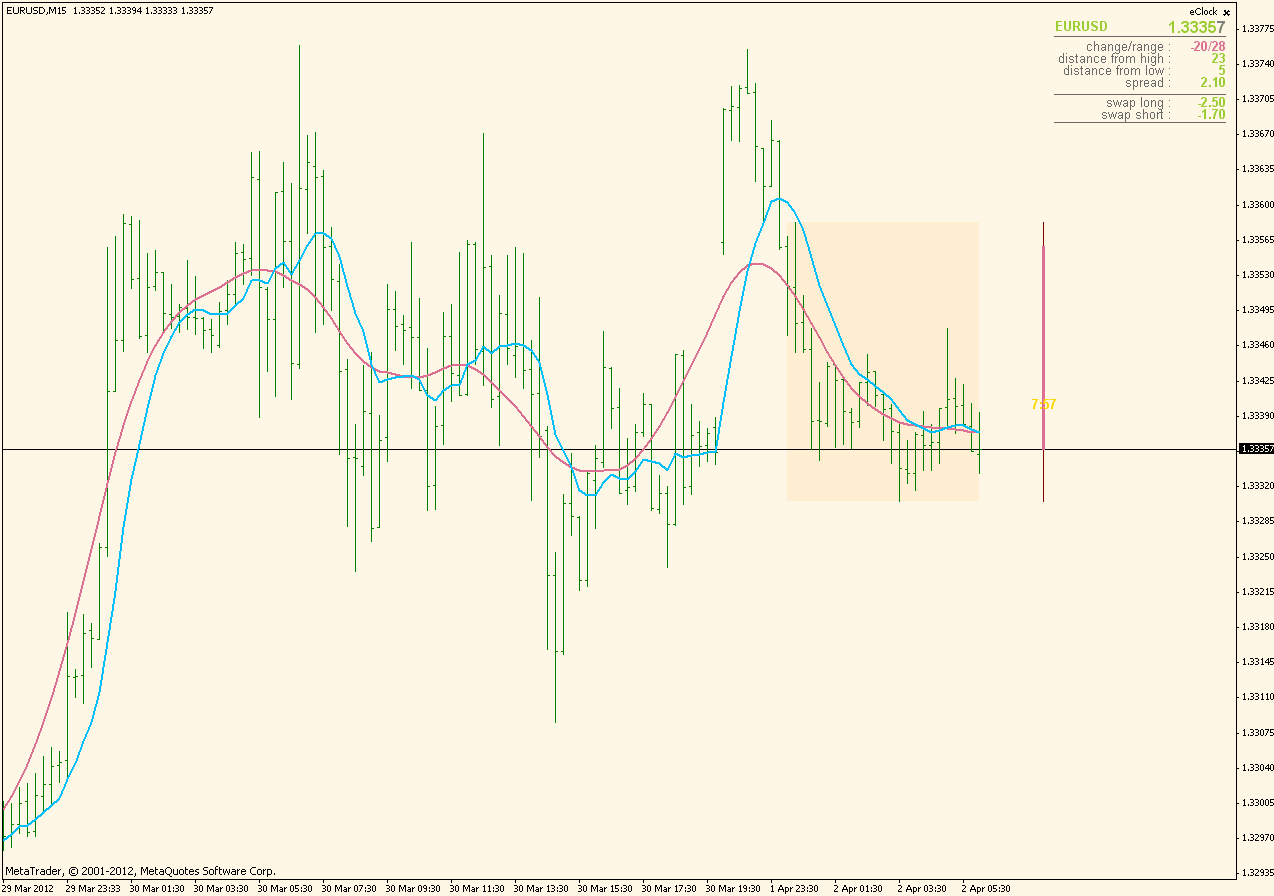
It's definition is fairly simple and one can be (among other places) be found here : Triangular Moving Average - Description of the Triangular Moving Average (TMA) . Here is how a normal triangular moving average looks like on a chart :
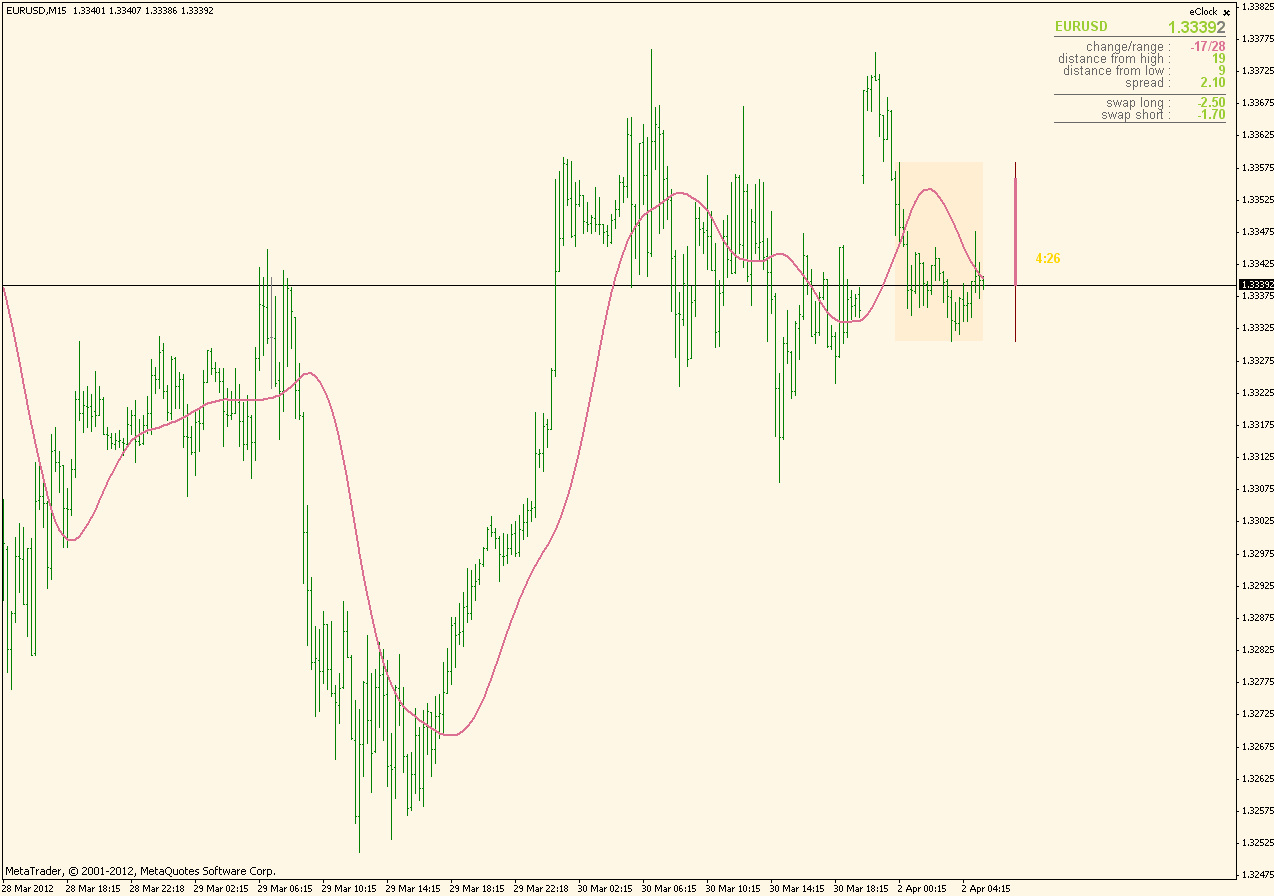
Now, at some stage of TA development people like Hurst and Brian Millard were thinking how can that be made better (since obviously there is a lag in the data that TMA is calculating - the most significant price in calculation is in the middle if the length so it is a half way from the current price, current price has less weight in that calculation) and they came to an idea that was already used in some other indicators : to "center" it.
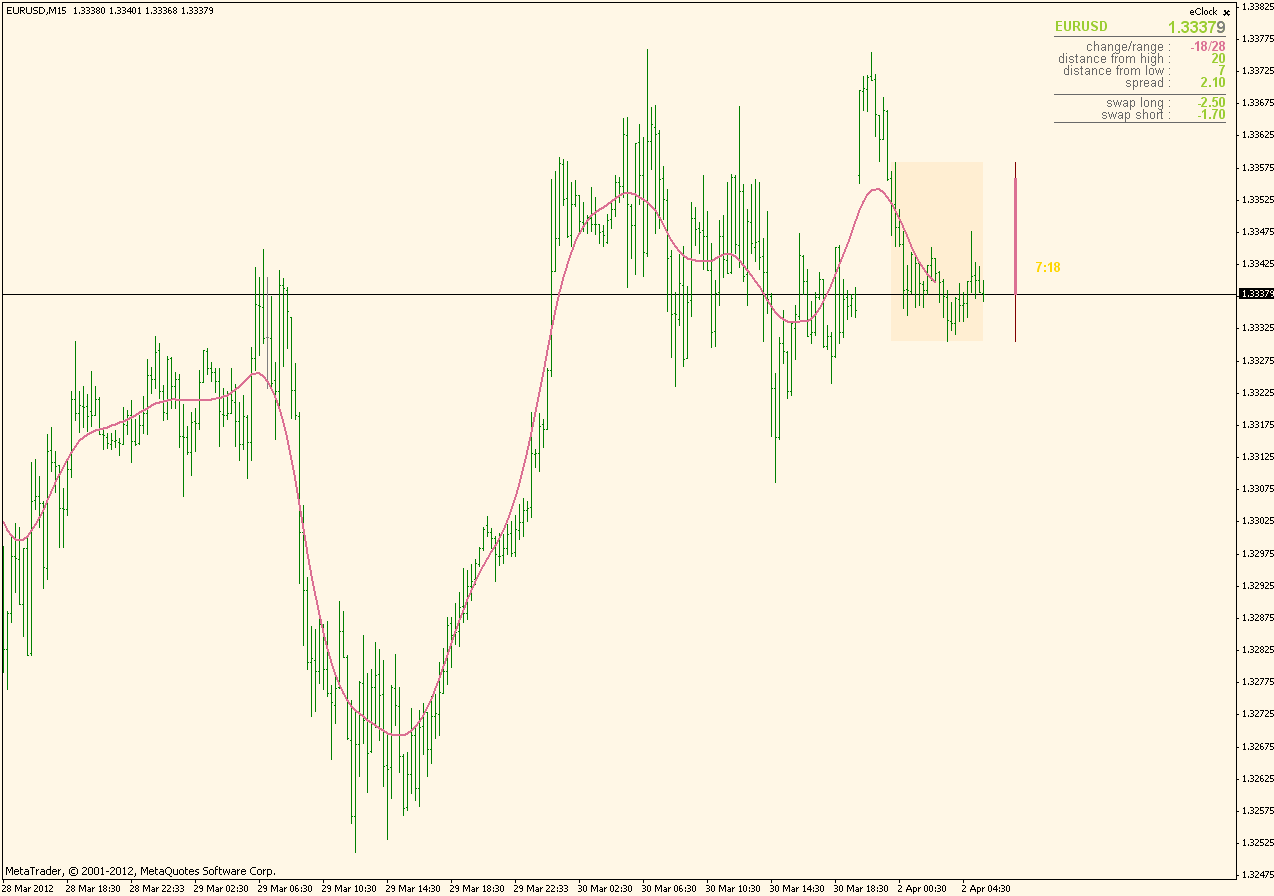
Now centering is simply shifting values to the left on the chart by half length bars and after doing that it looks like this :
As it is obvious, by shifting it to the left, it fits perfectly the data but it starts lacking data from the right. And then comes in the centered version of triangular moving average ...
Thanks Mladen,
really appreciated your lesson; you should start more threads like this.... your mailbox will be happy 
Best Regards
And the end ...
And for the end : one thing that is less known. The way how the centered triangular moving average is extrapolated makes the current bars value equal to one very well known moving average : linear weighted moving average. Current bar value of centered TMA is exactly the same as half length + 1 period LWMA. Here is an example at which it is obvious that at the end points they are exactly the same : red is the centered TMA and blue is the LWMA
And which makes the answer to the following question obvious : can it be "end-pointed" as SSA in order to make it non-repainting. The answer is yes and linear weighted moving average (LWMA) is the end-pointed centered TMA (so it is the non-repainting version of the centered TMA)
Now, that would be all. I just hope that my daily regular emails about TMA will lessen now that this is explained ... As it is obvious, it is a fairly good tool for estimation (the work of Brian Millard regarding this subject is very significant and I recommend everybody that can read his book about to do so - it might help understanding what were they after) but there is no magic nor wonder in it.
The Man With The Midas Touch
The purpose of this thread is more personal ...
At some stage (some 4 years ago, posted it at this post : https://www.mql5.com/en/forum/175938/page17I ) coded one variation of an indicator that I named TMA centered. After that somebody shortened it's name to TMA and ever since I am receiving emails and private messages about it in which people are asking me to make it non-recalculating, non-repainting, whatever ....
These few posts are going to explain what TMA is and what TMA is not ...Thanks for the TMAs and all the indicators you created and share with us. For me almost all the indicators are Truly Masterpiece 
secretcode
In order t avoid that missing data, people have found out that it might be extrapolated (the missing data) and that is what is usually used as centered triangular moving average : TMA that is shifted by half length to the left and the missing data is extrapolated in a certain way. Here is how the usual centered TMA looks like :
The gap from the right is filled in and it all looks just fine. Except that there is no 100% exact way of extrapolating data. So, that extrapolated gap is a subject of changes no matter what extrapolation method one uses (otherwise I would be drinking coffee with Warren Buffett in the morning and not in my kitchen). There is no way to make it non-changeable (non-repainting). None ... So much about the wonders of centered triangular moving averages : it is a good tool for estimation, but in no way should it be used in "signaling" mode since the signals are going t change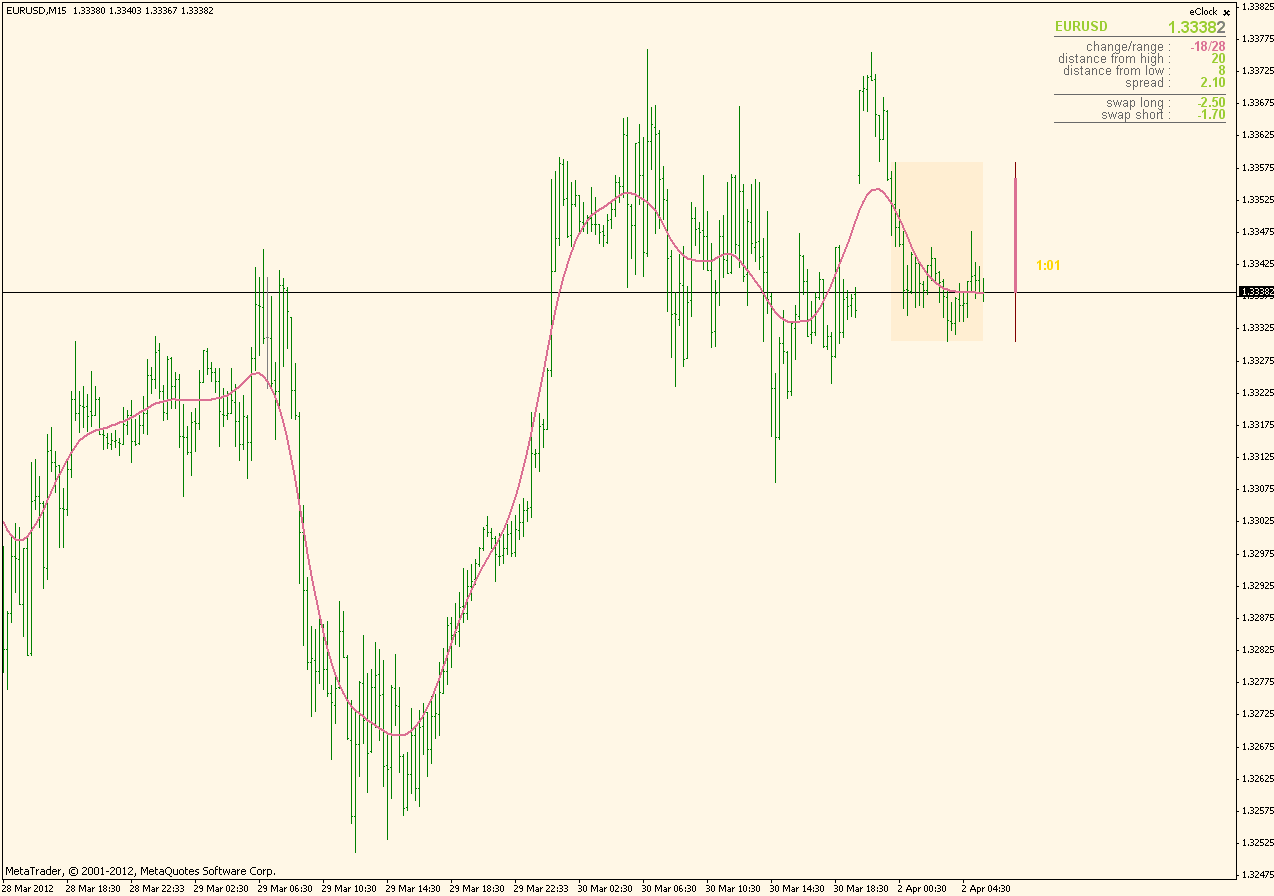
hi mladen. thanks for your analysis.
i use cycles for trading and for analysis the snake instead of TMA, because momentum can be shown for the 1st, not for the 2nd. snake(n) = TMA(n).
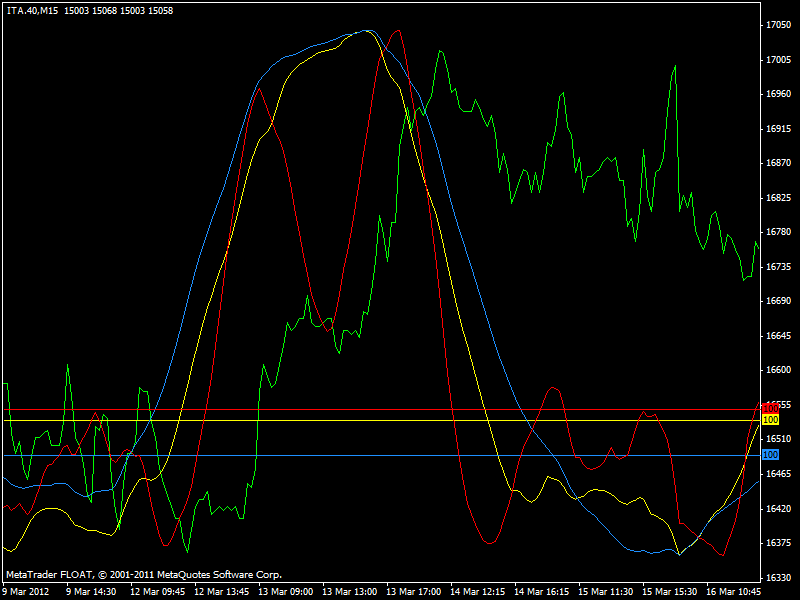
but here the problem i have: when applying momentum for example to 3 different snakes, the '100-line' is not unique and the resulting graph is not very easy to read (see below).
do you know if there's a way to have the different momentum plotted around one '100-line'?
thanks for your help.
I am not sure I understand the question completely, but lets try :
According to most common definitions of how momentum is calculated, there are 2 ways. Here is a quote :
Calculation
- Description: There are several variations of the momentum indicator, but whichever version is used, the momentum (M) is a comparison of the current closing price (CP) and a specific length of the previous closing prices (CPn).
- Calculation:
M = CP - CPn
Or
M = (CP / CPn) * 100
Metatrader is using the 2nd formula. If you replace close with the value of snake in your case or centered TMA you are going to get a momentum of either. Just make sure that you are recalculating at least half length bars (so that every bar that could be recalculated is calculated again to reflect true value of recalculated indicators values (snake and centered TMA recalculate as I explained, so you always must keep that in mind)
That is all. As you can see, momentum is quite a simple indicator for calculation
hi mladen. thanks for your analysis.
i use cycles for trading and for analysis the snake instead of TMA, because momentum can be shown for the 1st, not for the 2nd. snake(n) = TMA(n).
but here the problem i have: when applying momentum for example to 3 different snakes, the '100-line' is not unique and the resulting graph is not very easy to read (see below).
do you know if there's a way to have the different momentum plotted around one '100-line'?
thanks for your help.

I am not sure I understand the question completely, but lets try :
According to most common definitions of how momentum is calculated, there are 2 ways. Here is a quote :
Metatrader is using the 2nd formula. If you replace close with the value of snake in your case or centered TMA you are going to get a momentum of either. Just make sure that you are recalculating at least half length bars (so that every bar that could be recalculated is calculated again to reflect true value of recalculated indicators values (snake and centered TMA recalculate as I explained, so you always must keep that in mind)
That is all. As you can see, momentum is quite a simple indicator for calculationhi mladen,
sorry i might not be clear in my request.
the graph shows 3 momentums(1) of 3 different snakes. in order to have a better reading of the graph, the snakes are not shown.
as you can see, the '100' levels of the 3 different momentums are not unique, not at the same point.
my question is if there is a way in mt4 to show the '100' level for all 3 momentums at the same place (horizontal). the right word might be to have them 'overlay', but i'm not sure.
thanks again!
...
In case of a momentums like that (which are unbound indicators (without known minimum and maximum)) the only reliable way is to make 1 indicator that will show all those 3 values.
You can try by setting minimum and maximum of indicators properties for each of the 3 instances you are currently using, but if any of the values of the 3 indicators goes out of those minimum and maximum you will not see its value
hi mladen,
sorry i might not be clear in my request.
the graph shows 3 momentums(1) of 3 different snakes. in order to have a better reading of the graph, the snakes are not shown.
as you can see, the '100' levels of the 3 different momentums are not unique, not at the same point.
my question is if there is a way in mt4 to show the '100' level for all 3 momentums at the same place (horizontal). the right word might be to have them 'overlay', but i'm not sure.
thanks again!In case of a momentums like that (which are unbound indicators (without known minimum and maximum)) the only reliable way is to make 1 indicator that will show all those 3 values. You can try by setting minimum and maximum of indicators properties for each of the 3 instances you are currently using, but if any of the values of the 3 indicators goes out of those minimum and maximum you will not see its value
yes, i already tried setting min & max for the 3 momentums (like 98-102), but then they don't show up at all. probably because the values of the snakes are around 15000.
i'll keep my graphs as they are... 
anyway, many thanks for your help!
- Free trading apps
- Over 8,000 signals for copying
- Economic news for exploring financial markets
You agree to website policy and terms of use
The purpose of this thread is more personal ...
At some stage (some 4 years ago, posted it at this post : https://www.mql5.com/en/forum/175938/page17I ) coded one variation of an indicator that I named TMA centered. After that somebody shortened it's name to TMA and ever since I am receiving emails and private messages about it in which people are asking me to make it non-recalculating, non-repainting, whatever ....
These few posts are going to explain what TMA is and what TMA is not ...