The Murrey Math Trading System
this is Indicator
is possible EA ? 
Yes. But I think it is necessary to filter the signals.
I did not see any EA based on this system.
Murrey_Math_MT4_Period_VGhere the new Version Indicator Murrey_Math_MT4_.. by VG
caculate afters Periods GREAT !!!!
i have change Indicator for better backtesting
new name is Murrey_Math_Line_X 
Thanks Alex.
I translated comments in this indicator in English (see the translated indicator attached). Besides use the Description of Trading System (zip'ed html file, in english as well) for more information.
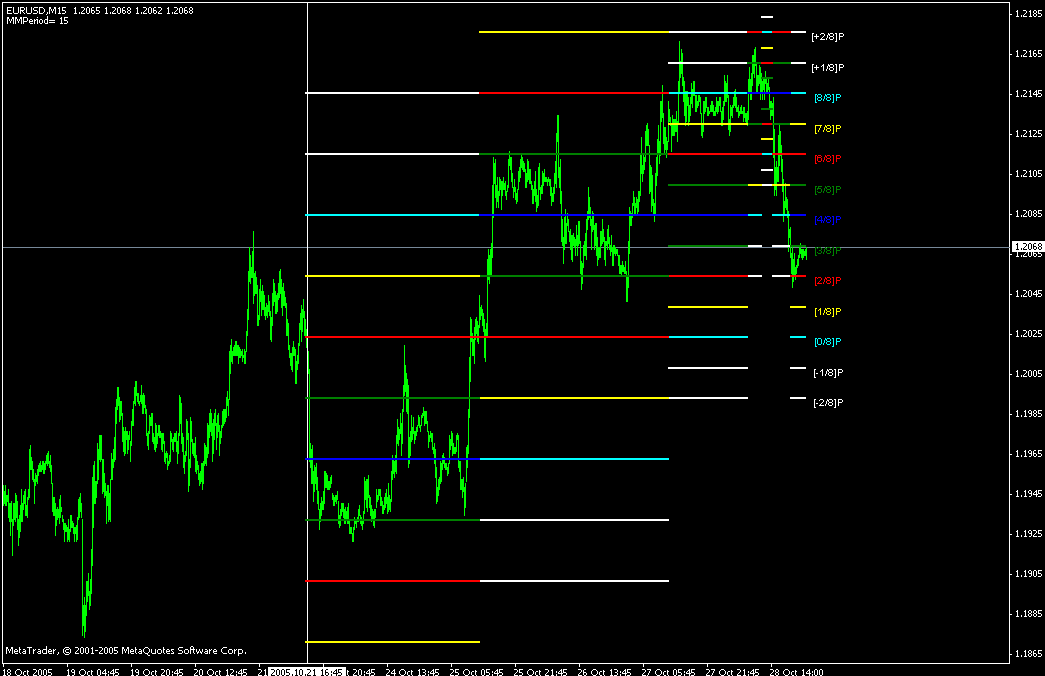
When you attach indicator to the chart you will see many lines:
1. Line 8/8 и 0/8 (Ultimate Support and Ultimate Resistance).
Those lines are the most strong concerning Support and resistance.
2. Line 7/8 (Weak, Place to Stop and Reverse).
This line is weak. If suddenly the price was going too fast and too far and stops around this line it means the price will reverse down very soon. If the price did not stop near this line this price will continue the movement to the line 8/8.
3. Line 1/8 (Weak, Place to Stop and Reverse).
This line is weak. If suddenly the price was going too fast and too far and stops around this line it means the price will reverse up very soon. If the price did not stop near this line this price will continue the movement down to the line 0/8.
4. Line 2/8 and 6/8 (Pivot, Reverse)
Those two lines yield the line 4/8 only to the strength to reverse the price movement.
5. Line 5/8 (Top of Trading Range)
The price is spending the about 40% of the time on the movement between the lines 5/8 and 3/8. If the price is moving near line 5/8 and stopping near the line during the 10 - 12 days so it means that it is necessary to sell in this "bonus zone" (some people are doing like this) but if the price is keeping the tendency to stay above 5/8 line, so it means that the price will be above. But if the price is droping below 5/8 line it means that the price will continue falling to the next level of resistance.
6. Line 3/8 (Bottom of Trading Range).
If the price is below this line and in uptrend it means that it will be very difficult for the price to break this level. If the price broke this line during the uptrend and staying above during the 10- 12 days it means that the price will be above this line during the 40% of its time moving between this line and 5/8 line.
7. Line 4/8 (Major Support/Resistance Line).
It is the major line concerning support and resistance. This leve is the better for the new sell or buy. It is the strong level of support of the price is above 4/8. It is the fine resistance line if the price is below this 4/8 line.
murray i really great, thanks for posting it. is it possible to see how it worked on past data? it seems that it shows only actual day?
murray i really great, thanks for posting it. is it possible to see how it worked on past data? it seems that it shows only actual day?
You are right saintan.
If we are able to see everything (all the lines) on the selected days we may test this indicator on the historical data.
thanks, will try that.
- Free trading apps
- Over 8,000 signals for copying
- Economic news for exploring financial markets
You agree to website policy and terms of use
Description of trading system (zip'ed html file) and some indicators (with the description inside the code - use MetaEditor to read).