Brokers Star - Daily Technical Analysis
A recap of yesterday (11th June 2013) analysis.
EUR/USD H4 Outlook
Yesterday we have a pretty long tail pin bar on our EURO H4 chart. It's located at our key support level at 1.3193 which serves as a strong signals for long entry. Those who are still holding the long positions as we suggested may move their stops to the swing low of the pin bar (somewhere at the red line).
If price retrace back to our key support level at 1.3193, we may have opportunity to add in our long position or go long here for those who are not in a long position yet (at our green box). If price continue to climbs higher and breach our resistance level at 1.3305 with strong momentum, then we may see price continue to climb higher.
Traders may scale out their position when price is near to the 1.3305 resistance level as commodity channel index (CCI) is also in overbought situation. Event though price is at a resistance level and CCI is in overbought situation, it is not recommended to go short here because price is trending upwards strongly.
12th June 2013
USD/CAD Technical Analysis
USD/CAD H1 Outlook
Trend is still down at this moment as we can see. Therefore going short is always safer than going long. We have a resistance level at 1.0216 where price do have some rejection at this level in the past few weeks. The green box on the chart is where short opportunity may arise for us to go short. Price action confirmation or any other confluences is needed before enter short position to make sure we do not get a fake signals.
If we go short there, we may take profit or lock in our profit when price hit our support level (blue line). If price break through this support level with strong momentum, we may see price continue to move lower to our next key support level at 1.0150 and the breakout may serve as an opportunity for breakout traders to go short.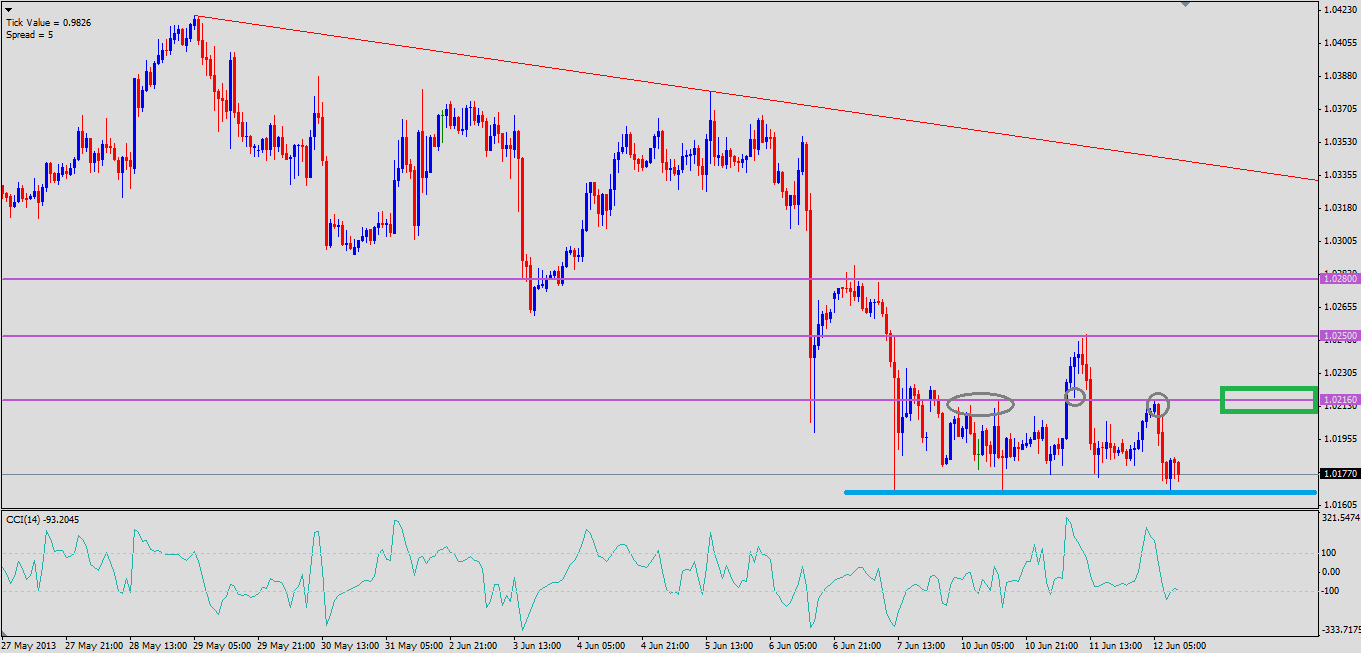
13th June 2013
USD/CAD Technical Analysis
As we expected in our yesterday post (http://on.fb.me/175cpsG) price do reject and move lower after hit our key resistance level at 1.0216. Price created a long tail pin bar at our key resistance level with Commodity Channel Index (CCI) overbought and price is also in a clear down trend as well.
Price has hit our key support level (blue line) as we expected as well. Those who went short should consider to cash in their profits or manage their stops according to the market condition. If price breaks below the support level with strong momentum, then we may continue to hold our short position and price may continue to falls lower to our next key support level at 1.0150.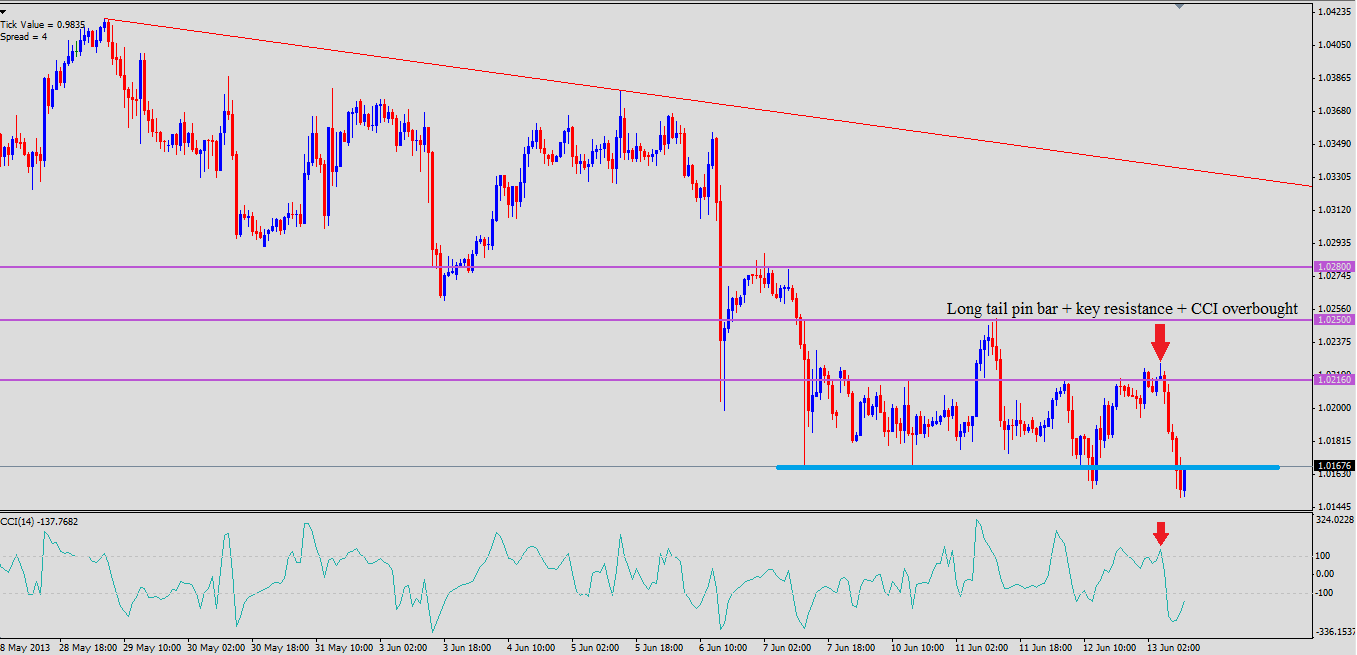
14th June 2013
GBP/USD Technical Analysis
GBP/USD H4 Outlook
Pound is very bullish at this moment as we can see. Therefore go long is considerably safer as always. Price is currently trading near our support level at 1.5605 which may gives us an opportunity to go long. Go long somewhere near the blue box is recommended. However, we will need price confirmation and any other confluences to confirm before going long here.
We have a support level below which may gives us a long opportunity as well (green line). If price breaks the previous swing high, we may see price continue to move upwards till our next resistance level at 1.5770.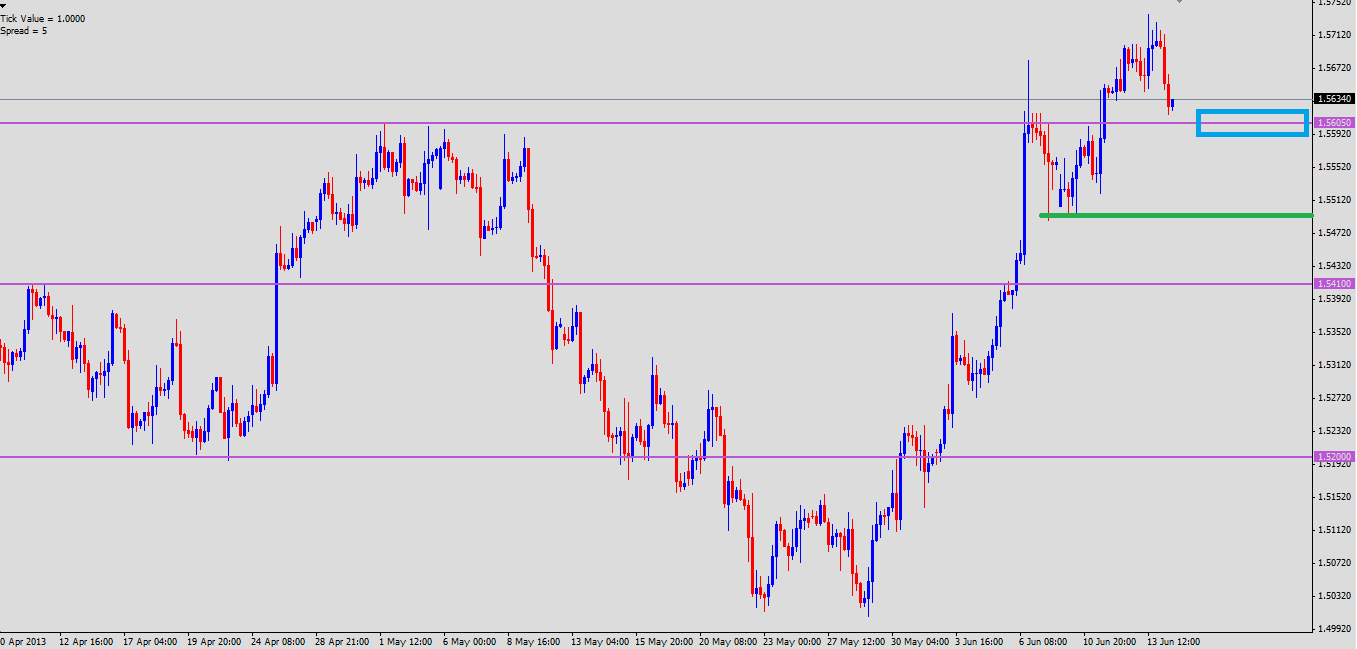
17th June 2013
USD/CAD Technical Analysis
USD/CAD H1 Outlook
Price moves lower after hit our resistance level as we expected in our 12th June 2013 post (http://on.fb.me/175cpsG) and price is stalling now at this moment, we have a resistance level (blue line) just above our current line and those who are in short position may move their Stop Loss to a few pips above this resistance level (blue line).
Besides, price also moves lower to our key support level at 1.0150 as we expected in our 13th June 2013 post (http://on.fb.me/10pSIZA). Should consider to scale out short position or close position. If price breaks our 1.0150 support level, we may see price continue to move lower to our next support level at 1.0110.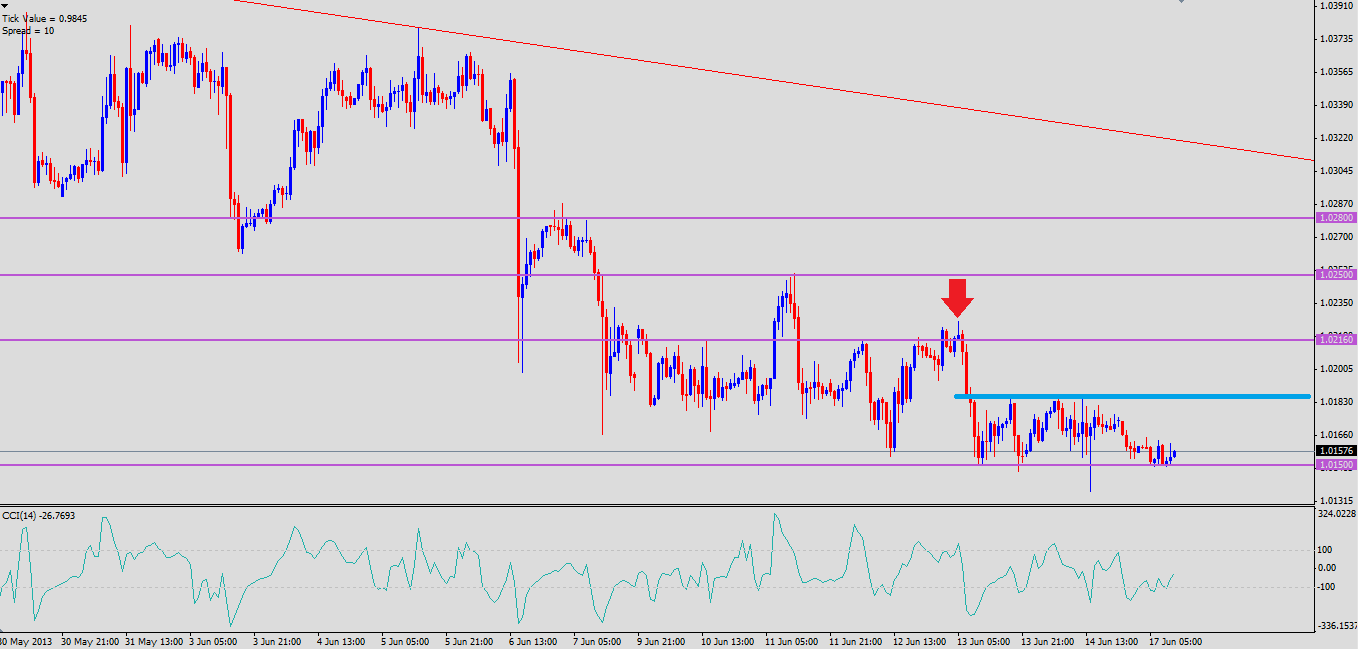
18th June 2013
GBP/USD Technical Analysis
GBP/USD H4 Outlook
In our 14th June 2013 post (http://on.fb.me/19MGXzC) we expected that price will react at our key support level at 1.5605 and price do react at there. Currently price travel back to our key support level again at 1.5605 and this may provide us some long opportunity. Commodity Channel Index (CCI) is also in a oversold situation.
Trend is still bullish at this moment as we can see. Therefore this 1.5605 support level may worth to go long but since price has reacted before at this support level, thus it's weaker right now. If price breaks our 1.5605 support level with strong momentum, we may see price continue to travel to our next at 1.5410 which is a great place to go long as well.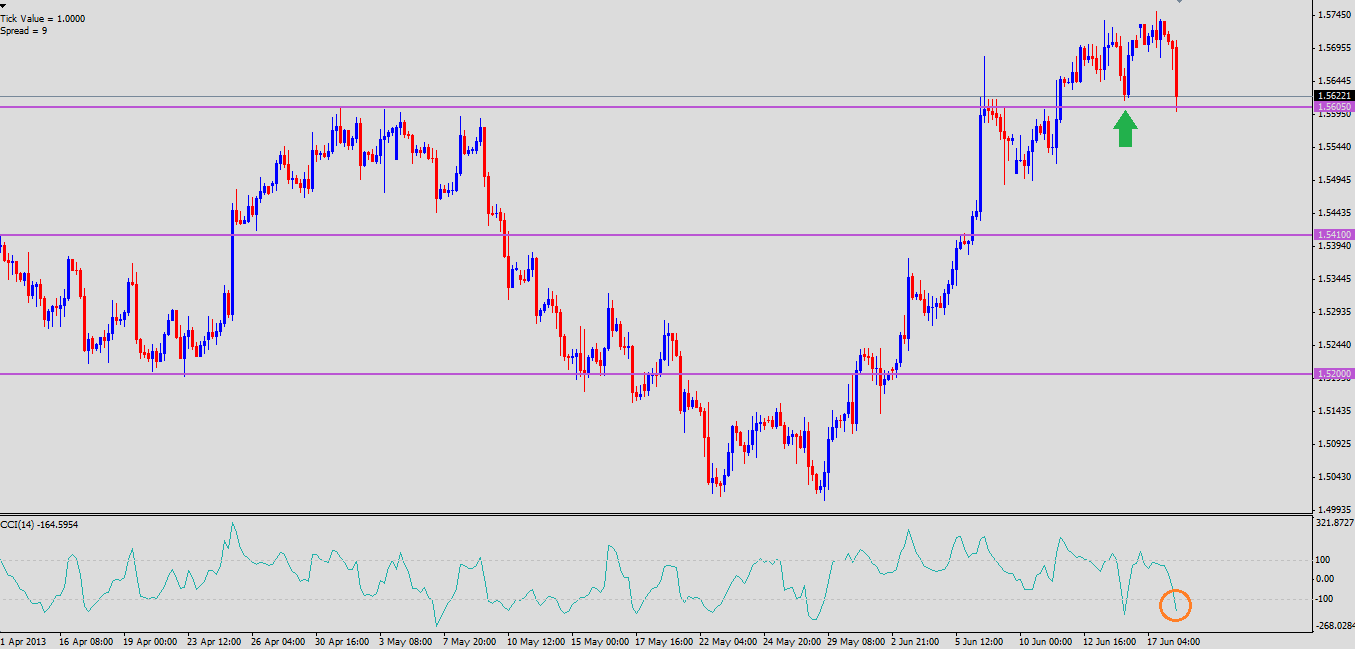
19th June 2013
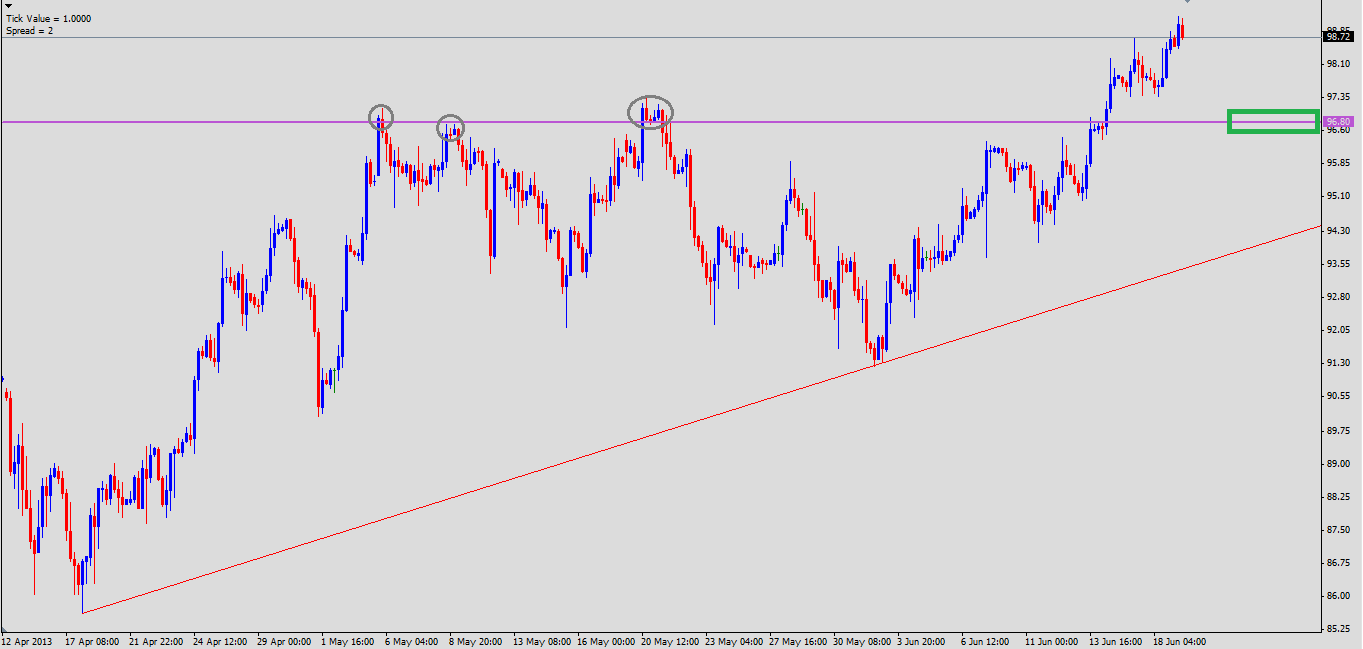
US Oil Technical Analysis
Trend is very bullish at this moment, we should be looking for long setup only with this strong up trend. We have a support level (previous resistance level) at 96.80 which we may go long there (green box). If price came down to our support level with price action confirmation or any other confluences, this level will be a high probability long setup for us and the last swing high before price coming back may serve as our profit target or we may lock in some of our profits there.
20th June 2013
Gold Technical Analysis
Gold H4 Outlook
Gold continue to breaks lower and it's currently trading at 2 years 8 months low. Price has been in a clear down trend since last year and recently breaks lower which suggest bears are still in control! Therefore we should be looking for short rather than catching the falling knife!
We have our key resistance level at 1340.00. This level may give us a high probability setup since it's so bearish at this moment. Even though it is high probability setup, we shall always look for confirmation or any other confluences before going short. We may consider to hold our short position if price breaks through the last swing low.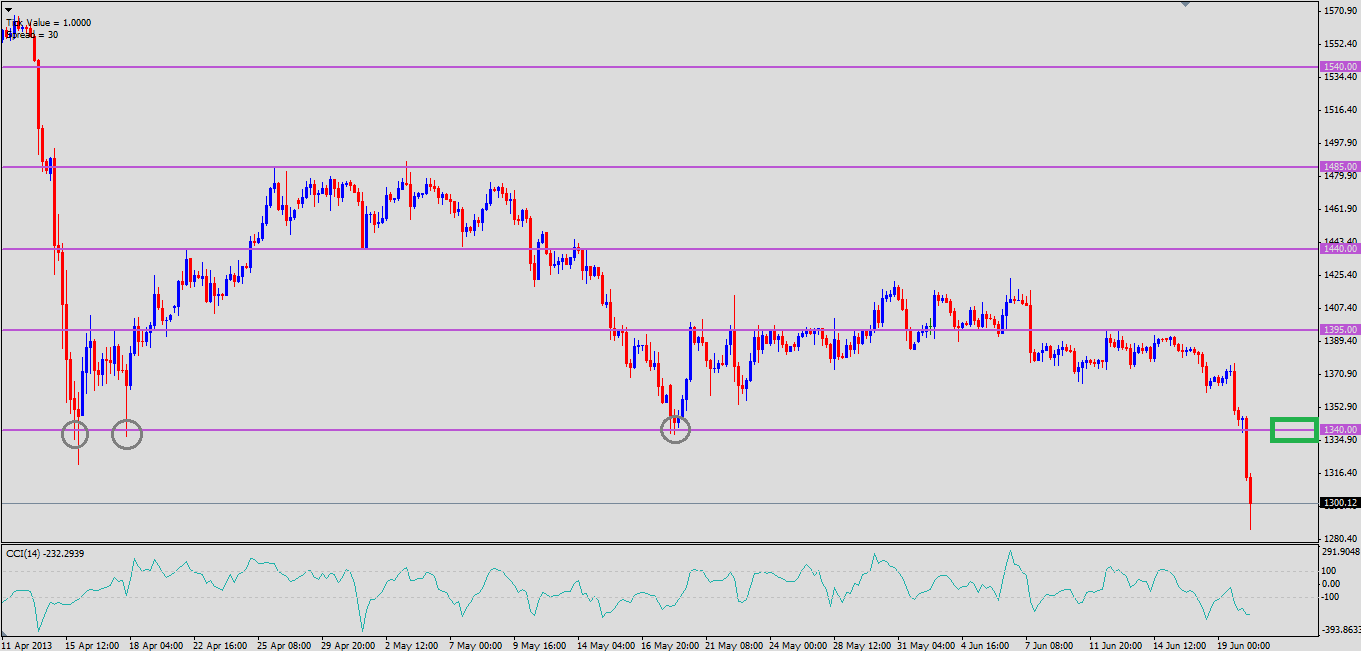
21st June 2013
USD/CAD Technical Analysis
USD/CAD H4 Outlook
Price is in a strong up trend since the FOMC report that is released in Wednesday. Since the trend is still very bullish, we should look for some long setups.
Price is currently trading at our current resistance level and it seems to going to break however it's safer to wait for the price to comes back to the support level at 1.0288. Going long near the green box will offer us a higher probability trade. As usual, price action confirmation and other confluences is needed before we consider to go long. Our next key support level is at 1.0150. Weekend is coming and we shall liquidate our short term positions to avoid any losses that is caused by the weekend gaps.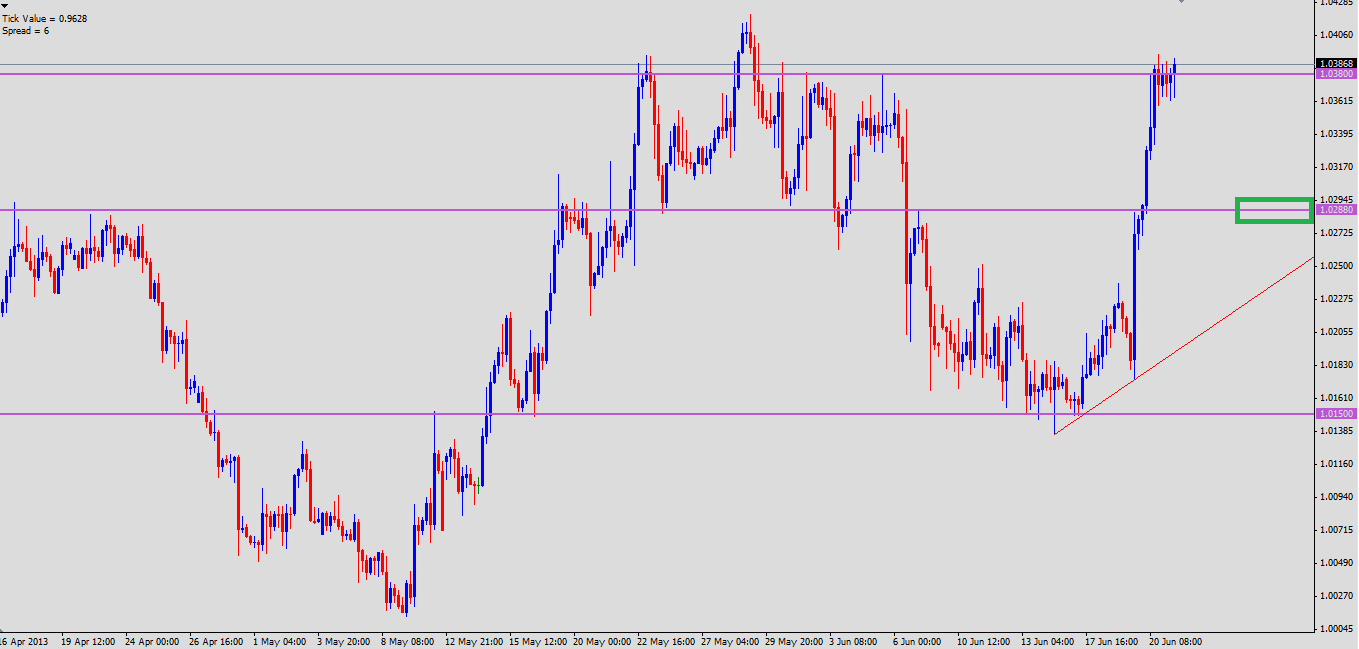
24th June 2013
GBP/USD Technical Analysis
GBP/USD H4 Outlook
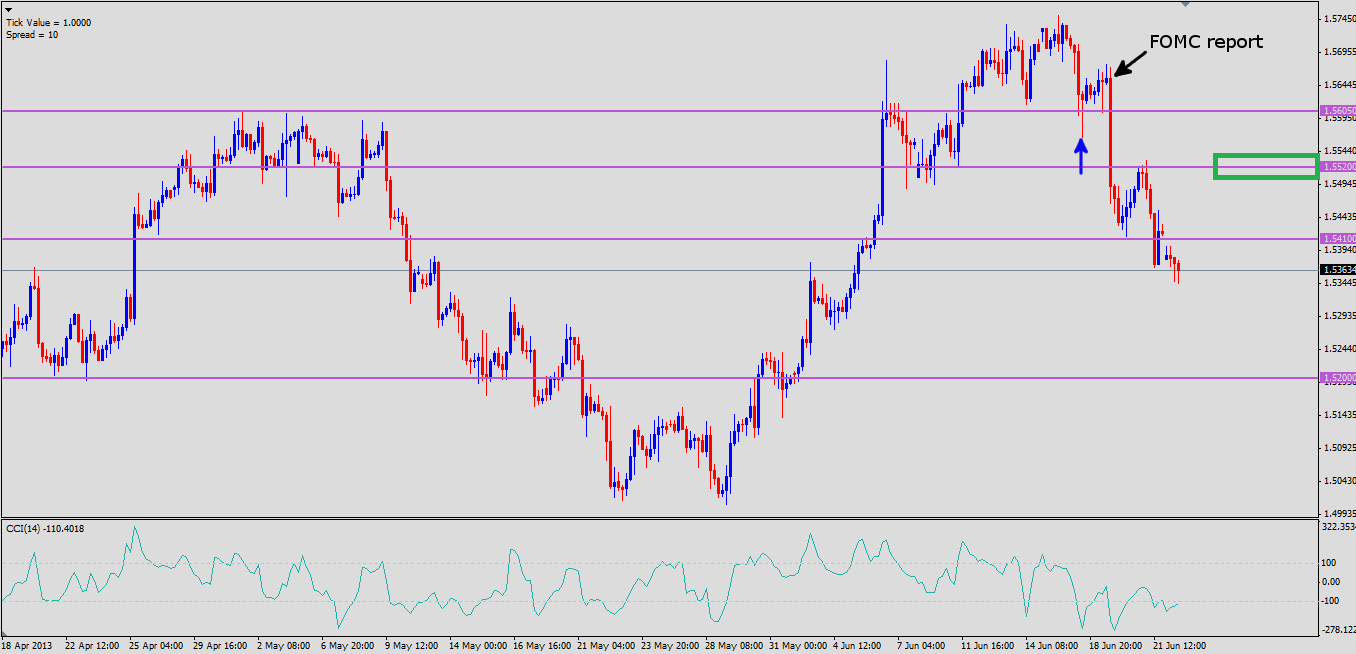
Price created a long tail pin bar at our key support level at 1.5605 and move higher from our support level as we expected in our 18th June 2013 post. However, price drops drastically later. It's caused by the FOMC news from the US. We should always stay out from the market when these high impact news being released or at least move Stop Loss to Breakeven.
Our previous support level 1.5605 is now a resistance level which is a good level to go short. We also have a resistance level at 1.5520 which price is likely to make a turn here or have some pullbacks before it goes to 1.5605. Price action confirmation and other confluences is needed as usual to lower the chance of getting false signals.
- Free trading apps
- Over 8,000 signals for copying
- Economic news for exploring financial markets
You agree to website policy and terms of use
Hello fellow traders!
I will update Brokers Star Daily Technical Analysis in this thread. These analysis are meant to give traders an overview of the daily FOREX market. The source of these analysis are from Brokers Star Facebook page and group. Below are the links to Brokers Star Facebook page and group:
Please feel free to ask any questions and I will try my best to answer.
Hope this is helpful.