Daily Analysis by TradeOmatic's team
Who we are?
We are a group of young people come from various of backgrounds: trader, network engineer, software engineer, and financial analyst. Our common hobby is to develop an application that can analyze the stock/financial market automatically. The purpose is not to replace human trading, but to act as a major aid for any traders to reduce the risk of emotional trading. From those ideas, a project named TradeOmatic was formed.
What we do?
The TradeOmatic was started in October 2012. The application is built from the ground with our plain ideas from the beginning. The current preliminary date for the first release is around May 2014. From now on, we will actively post our analysis to thread as trading journals, and all comments/feedback are welcome.
If you have any direct questions or concerns, feel free to contact us.
What is TradeOmatic?
TradeOmatic is the only application in the market that integrates the legendary Wyckoff, VSA, and Elliot wave patterns into a convenience package. TradeOmatic shows you the trading ranges and high probability trade setups from Wyckoff, VSA and Elliot Wave. Most importantly, the application is backed up by statistical analysis and machine learning. For more information about TradeOmatic's features and technical please check out our website.
And, here is one high probability trade setup for today
Our trading setup scanner found one nice Elliot Wave setup on the chart of Discover Financial Services (DFS). Let’s look at the chart below and analyse it together.
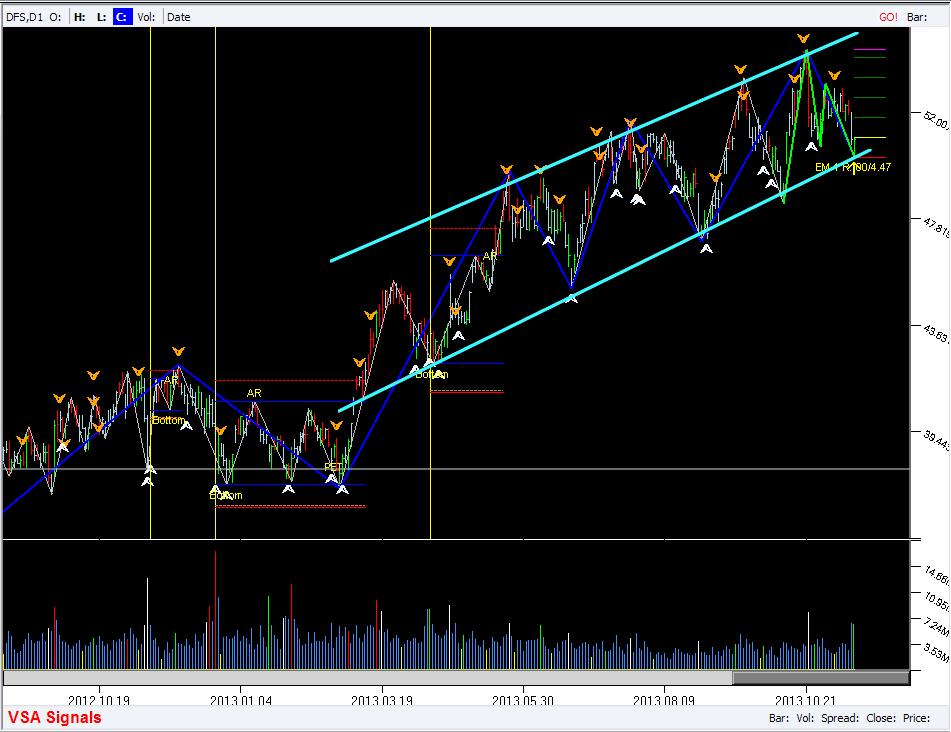
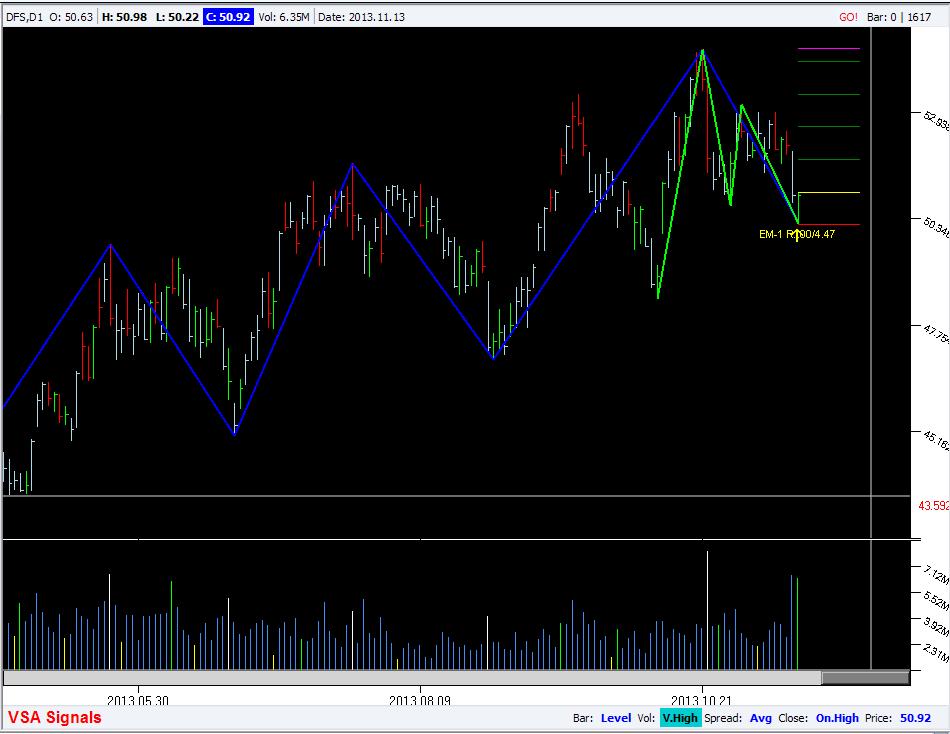
Chart Analysis
Price action is contained within a firm uptrend channel, and right now, the price is at the bottom of the uptrend channel. The low of the current bar nicely touches the bottom channel line of an uptrend, which is a good sign if you want to go long. As our system shown on the first chart, there was a Wyckoff-VSA trading range around 01/2013. This trading range is the cause of the recent strong uptrend (effects). And right now, to the right edge of the chart, there is an Elliot Wave setup that go harmonically with the trend, you might enter a long setup here if you want to play a high winning probability trade. That’s what we want to see, any setup that has Wyckoff-VSA trading range in the background, and hindsight price trend, and the setup at the right position.
Analyzing statistically, our scanner shows that the winning rate is pretty high. Bayesian network predict the chance of winning this setup is 49%, which is more than acceptable for a good risk reward trade setup.
For a long setup like this one, you need to set a pending order at the high of the current bar (setup bar). By trailing the bar’s high, we are catching the trade when it starts moving into our direction.
On the chart, we plot the trailing levels for the price. When previous bar closed completely above the line, move your stoploss to that line.
Setup factors:
- Setup date 11/14/2013
- Bayesian probability of winning: 49%
- Omatic-Score of the setup: +0 point
- ABC corrective pattern in UP trend
- Enter: Buy stop at High of the current bar: $50.99
- Recommend Stop Loss: Low price of the bar with buffer = $50.21 – $0.10 = $50.11
- Recommend Take Profit: $54.48 (Risk:Reward: 1:4.47)
o Trailing lv1: $51.78
(When Low of bar above this level, move SL to break-even)
o Trailing lv2: $52.58
(When Low of bar above this level, move SL to lv1)
o Trailing lv3: $53.37
(When Low of bar above this level, move SL to lv2)
o Trailing lv4: $54.16
(When Low of bar above this level, move SL to lv3)
Elliot Wave Setup on GPI chart – 11/14/2013
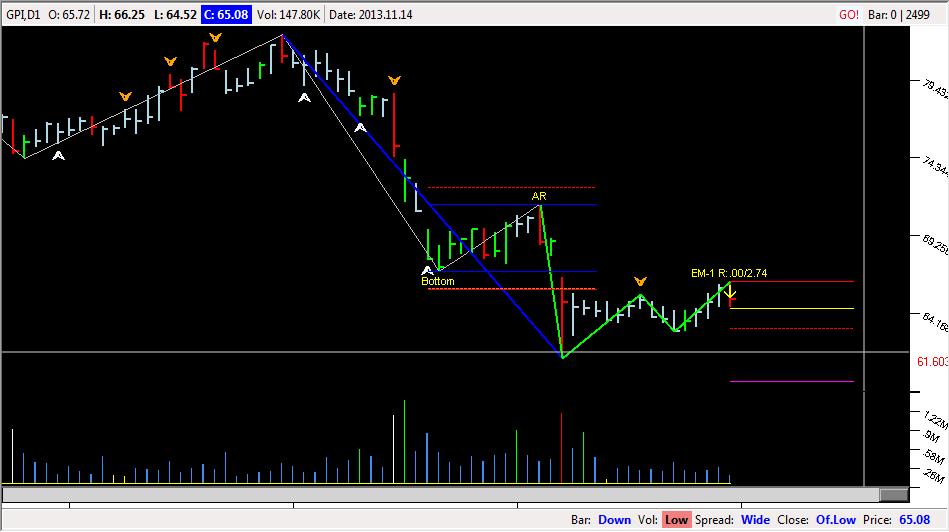
We just got the scan results from TradeOmatic today, and there is a high probability setups with the score 90 and Bayesian probability is more than 50%. The stock chart is GPI, Group 1 Automotive, Inc. Here is the screenshot of the chart created by TradeOmatic.
Our Analysis
The recent price action looks like it is at the spring board with less volume than 20 bars behind it, that is the only thing that we concern right now. And the rest, all of the facts of the setup are good. We have a stiff downtrend with good angle to the left. In addition, the chart just redistributed by forming a failed trading range in Octorber 2013. This failed trading range might be a strong resistance for the price to break and jump over it. In other words, the current Elliot Wave setup is right at the major resistance level. This major resistance is the barrier for the stock to break, so we might have higher probability of winning with going short.
Regarding Wyckoff-VSA trading range – in this setup, we recently had a failed trading range that broke below the support level. This trading range and old support level now became strong resistances that prevent price from coming up in the near future.
TradeOmatic measures all of the setup’s facts such as angles between the setup’s legs, angle of the trend, Fibonacci retrace levels, etc, to give the highest probability setups. We don’t expect this method to work as a Holly Grail, but we expect it to add more edges and winning probability to our trading approach.
Setup Facts
- Setup date 11/15/2013
- Bayesian probability of winning: 53%
- ScoreOmatic of the setup: +90 point
- ABC corrective pattern in DOWN trend
- Enter: Sell Short stop at Low of the current bar: $64.51
- Recommend Stop Loss: High price of the bar with buffer = $66.25 + $0.10 = $66.35
- Recommend Take Profit: $59.70 (Risk:Reward: 1:2.74)
o Trailing lv1: $61.60
(When High of bar below this level, move SL to break-even)
o Trailing lv2: $61.85
(When High of bar below this level, move SL to lv1)
o Trailing lv3: $60.53
(When High of bar below this level, move SL to lv2)
o Trailing lv4: $59.20
(When High of bar below this level, move SL to lv3)
DISCLAIMERS:The setups posted in this thread is the result of our research and analysis. The posts are for educational and research purposes. Use it and your own risk. We do not intend to provide any financial recommendation. As that being said, we hold no reliability or responsibility to any potential damanges and losses that might happen during your tradings as the results from these posts.
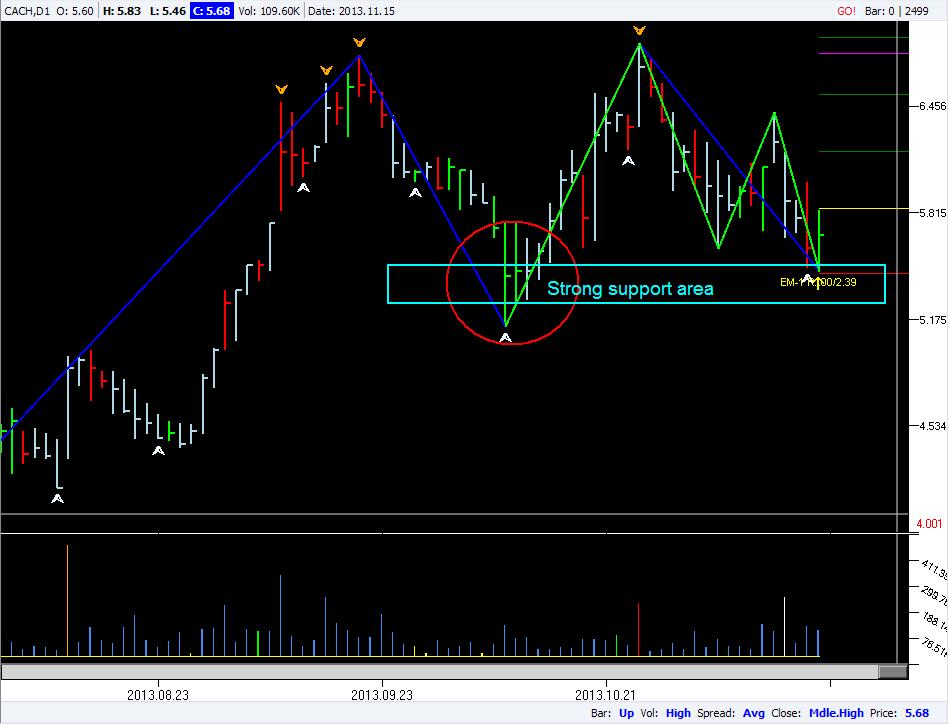
Today, our trading setup scanner found one nice Elliot Wave setup on the chart of CACH (Cache. Inc). Let’s look at the chart below and analyse it together.
A nice RR 2.39 - Elliot Wave setup on CACH chart, Nov 15, 2013 - Zoom out
A nice RR 2.39 - Elliot Wave setup on CACH chart, Nov 15, 2013 - Zoom in
Chart Analysis
- There is a strong up trend from 12/14/2012, and the uptrend is contained within a channel. Currently, price action is right at the bottom line of the uptrend channel, which has high probability of bouncing up for a long setup. The Elliot Wave long setup has more probability if it has supports from an uptrend. In other words, the setup is to jump on to the major uptrend resume.
- Speaking of support and resistance levels, the price action is at the support level where it has a spring to the left. The support level adds more probability to our long setup. In addition, and more importantly, the spring to the left is where a strong VSA signal: Potential Professional Buying. This is a good sign of professional support for a profitable long setup.
- The chart has nice and clean corrective legs for an Elliot ABC setup. Based on our statistical analysis, the setups which have clear factors for Elliot Wave have more probability of winning.
Setup factors:
- Setup date 11/15/2013
- Bayesian probability of winning: 50%
- Omatic-Score of the setup: +50 point
- Clean ABC corrective pattern in UP trend
- Setup at channel line: Yes
- Setup at support/resistance: Yes
- Setup has VSA support: Yes
- Enter: Buy stop at High of the current bar: $5.84
- Recommend Stop Loss: Low price of the bar with buffer = $5.45 – $0.10 = $5.35
- Recommend Take Profit: $6.77 (Risk:Reward: 1:2.39)
o Trailing lv1: $6.18
(When Low of bar above this level, move SL to break-even)
o Trailing lv2: $6.53
(When Low of bar above this level, move SL to lv1)
o Trailing lv3: $6.87
(When Low of bar above this level, move SL to lv2)
Today, our trading setup scanner found one nice Elliot Wave setup on the chart of LSI Corporation (LSI). Let’s look at the chart below and analyse it together.
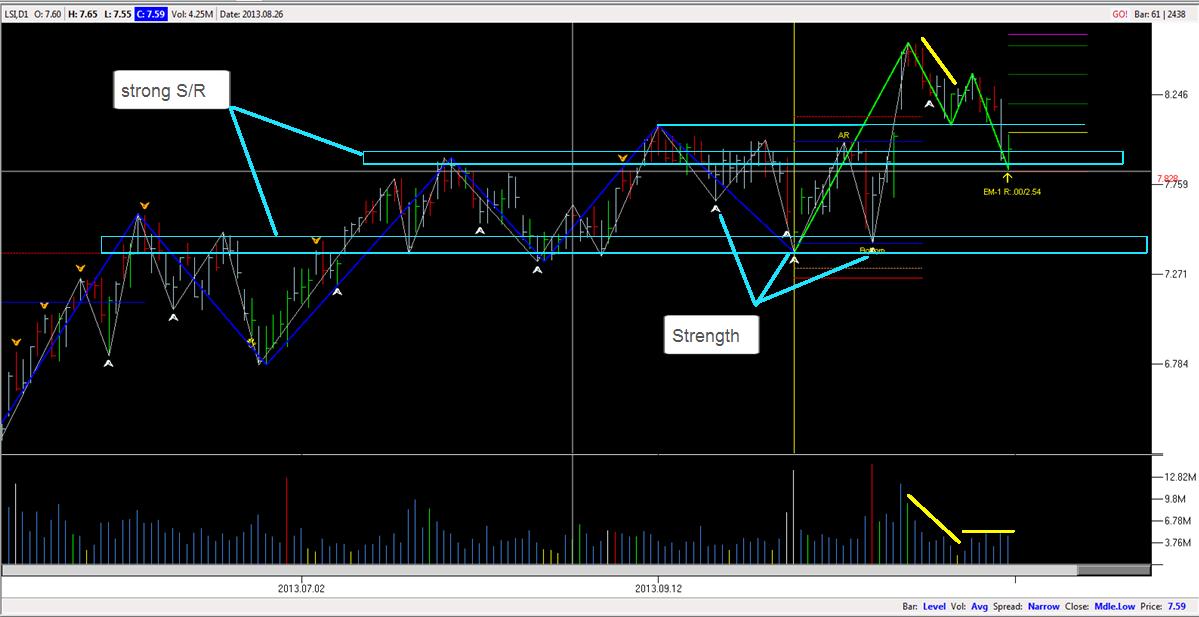
Elliow Wave setup on LSI Corporation
Chart Analysis
Our scanner shows the highest score today is only 0, which is the lowest acceptable score for trading. We decided to analyse this setup in terms of Wyckoff-VSA methods. It turned out the setup is not really bad for LONG direction.
Looking at the legs of the Elliot Wave, it’s nice, isn’t it? The leg is long enough and clear (our scanner graded these factors as we collected it). The setup bar is green, and is a strong bar in term of VSA.
Let’s talk about the background of the chart. TradeOmatic shows that there are two strong support levels at and below the setup. These support levels are strong as it came through many peak and bottoms of the price recently. These levels add the probability for our long setup.
In terms of Wyckoff-VSA theory, there was a trading range with gap up just before our Elliot Wave setup. This trading range has two strong VSA signal line on top of the bottom support level. Price action recently broke the trading range and gap up, which is the first good sign. Down trend on reduced volume is another sign of strength that we can add to the setup.
After analysing all of these factors, we can see this setup deserves more than 0 score because it has support from Wyckoff-VSA trading range and from strong support levels below it.
Please note that our entries are all trailing previous bar’s low or high. In some case, we might recall the setup BEFORE it’s executed to prevent a bad trade. We follow up every trade we posted. You can see our analysis and recalls on our blog.
Setup factors:
Symbol: LSI
Setup: EM-1
Setup Date: 11/20/2013
Direction: LONG
Price: 7.84
Pending Price: 8.04
Stop Loss: 7.83
Target Price: 8.57
Target In %: 6.63%
1R_in_%: 2.61%
theoryRR: 2.54
B.Win%: 47.49%
Score: 0
Score %: 40.08%
LV.1: 8.2
LV.2: 8.36
LV.3: 8.51
(When Close of bar above next level, move SL to previous level)
DISCLAIMERS: The setups posted in this thread is the result of our research and analysis. The posts are for educational and research purposes. Use it and your own risk. We do not intend to provide any financial recommendation. As that being said, we hold no reliability or responsibility to any potential damanges and losses that might happen during your tradings as the results from these posts.
Today, our trading setup scanner found one nice Elliot Wave setup on the chart of Fortuna Silver Mines Inc (FSM). Let’s look at the chart below and analyse it together.
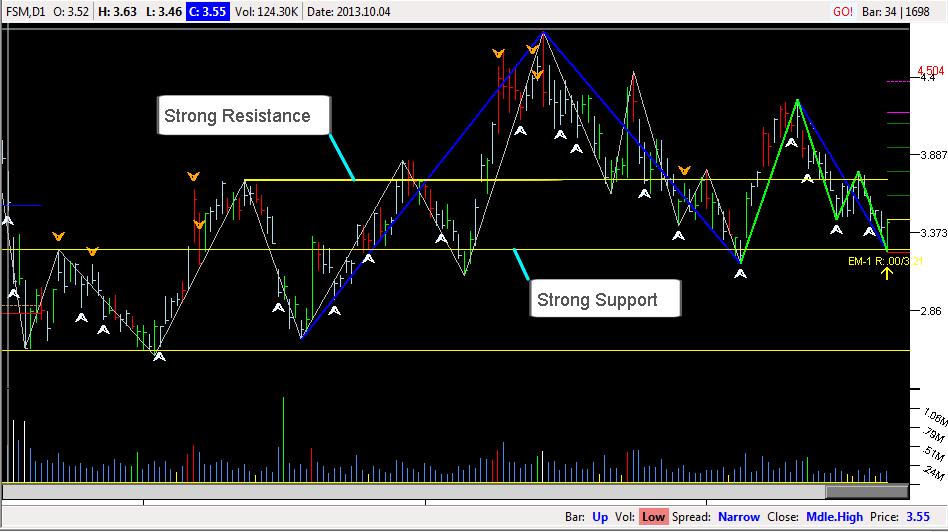
Chart Analysis:
FSM is the highest score as of 40. Bayesian probability is only 42%. Let’s see how it looks.
First of all, the Elliot Wave legs are nice and clear. TradeOmatic only picks the highest probability trade setups to show you, and wait for you to make the final decision. Statistic shows that nice and clear wave legs setups have higher chances of winning.
The major trend in this setup is not really nice. For that reason, the score is not higher than 40 because it has some bad factors. Trend is one of it. Surprisingly, our statistical analysis shows that the trend in this kind of setup is not a major factor! It sounds against what you know about the trend, doesn’t it?
In fact, Wyckoff and VSA signals play important roles in any trading setup. We can trade purely with Wyckoff-VSA, or we can use Wyckoff-VSA as background reference for the chart. In this FSM setup, we have strong support from the Wyckoff-VSA background. The current EM-1 setup is above the trading range formed from mid April 2013 to August 2013. At the moment, price action comes back to the top of the trading range for testing the supply. However, the trading range below the setup shows that there are more demand than supply in this case.
One addition fact of this EM-1 setup is its location. The setup right now is at a strong support level right below it. This support levels add more probability for the LONG setup.
Remember that trading is the game of probability. The higher probability you have, the more edge you have, and the better chance of winning.
Setup factors:
Symbol : FSM
Setup : EM-1
Setup Date : 11/21/2013
Direction : LONG
Price : 3.25
Pending Price : 3.46
Stop Loss : 3.24
Target Price : 4.17
Target In % : 20.41%
1R_in_% : 6.36%
theoryRR : 3.21
B.Win% : 42.12%
Score : 40
Score % : 40.00%
LV.1 : 3.62
LV.2 : 3.78
LV.3 : 3.93
LV.4 : 4.09
(When Close of bar above next level, move SL to previous level)
Hello all, it’s been a few days that we don’t post any EM-1 setup because there are no setups better than 0 score. Trading setups with Score larger than 0 have higher probability of winning.
Inspired by David H. Weis in his book Trades About to Happen, we created a scanner to automatically detect those trade setups withUpthrust and Spring at major Support & Resistance levels. We call these setups PVSRA-3, namely Price, Volume, Support and Resistance Analysis. TradeOmatic can calculate all major support & resistance levels and use it as inputs for the scanner. All of these levels can be plotted directly onto the chart automatically. Let’s look at the PVSRA-3 setup for tomorrow, 11/27/2013. Chart symbol GDOT (Green Dot Corporation).
There aretwo major support and resistance levels that form a trading range for this setup. Our support/resistance indicator shows that a strong resistance has been formed around $25.00. This round number resistance level was tested by time. Previously, a nice-shape Upthrust appeared at this strong resistance and failed to break this level, which is weakness.
In addition, looking back to the left a few bars, there are some other weaknesses. On 11.01.2013, huge supply came in. The next bar closed on the low and formed a Two Bar Reversal. This is a serious sign of weakness. And please note that the two bar reversal occurred at the strong resistance mentioned above. To this point, we have two serious sign of weakness at a major resistance level.
Moreover, price action is currently at the top channel line of a down trend on low volume. There is no effort to break this top channel line at this moment. Add +1 to the bearish direction.
A potential SHORT trade setup’s information can be
- Trailing to enter at $24.24
- Stoploss at $26.06 – avoid the round number $26.00
- Take profit at $20.12
- Setup RR is 1:2.26
Watch the chart closely when it reaches $22.48 because there might be some interesting price actions at that point.
Wyckoff, Supply & Demand Analysis with Elliot wave setup on VRTS chart - 12/05/2013
After more than a week without any setups, today we pick 2 high probability trades for US Stock market. The first one is VRTS (Virtus Investment Partners Inc). The stock price is pretty high at the moment. If you can afford the capital to trade this stock, it might be a good chance to earn some extra income with this 5+ risk reward ratio.

Wyckoff, Supply & Demand Analysis with Elliot wave setup on VRTS chart
Even the score of this setup is -10, but it has good Bayesian probability up to 44%. These numbers are based on our statistical analysis with this type of Elliot setups on over 3000 symbols from 2004. With these numbers, one can expect to see a high probability trade setup. Let’s talk about the technical factors of the setup.
First of all, for Elliot wave setup, it must have a major trend to resume. There has been an uptrend in September 2013, and now price is waiting to resume that major uptrend.
In addition to pure technical analysis with price and Elliot wave, TradeOmatic now has the capability of integrating Wyckoff, Supply & Demand Analysis into the system. In the current setup, VRTS has good support in terms of Support & Resistance Analysis. A major downtrend in late May 2013 was almost ended with someclimactic action bar. In the picture, we have two areas of climactic actions. In September, the new uptrend is formed by the huge volume climactic action bar. Price gapped up and push through the old resistance level of July 2013. That resistance level now has became a support area for the price.
And now, to the right edge of the chart, price is touching the new strong support (which was strong resistance, broken by the gapped up bar) on low to very low volume.
So, what’s about the low volume at this point? Low volume when price returns to climactic action range or major support zone like in this case means there is no effort to break down this support area. With the support and strong background in terms of Wyckoff and Supply/Demand Analysis, we see this is a high probability LONG trade setup.
ABC pattern combine Supply Demand analysis on MDR chart - 12/05/2013
This is the second high potential setup that our scanner picked today, MRD (McDermott International, Inc.). The setup has 10 points, and Bayesian probability is 44%. These numbers are good for high probability trade setups.
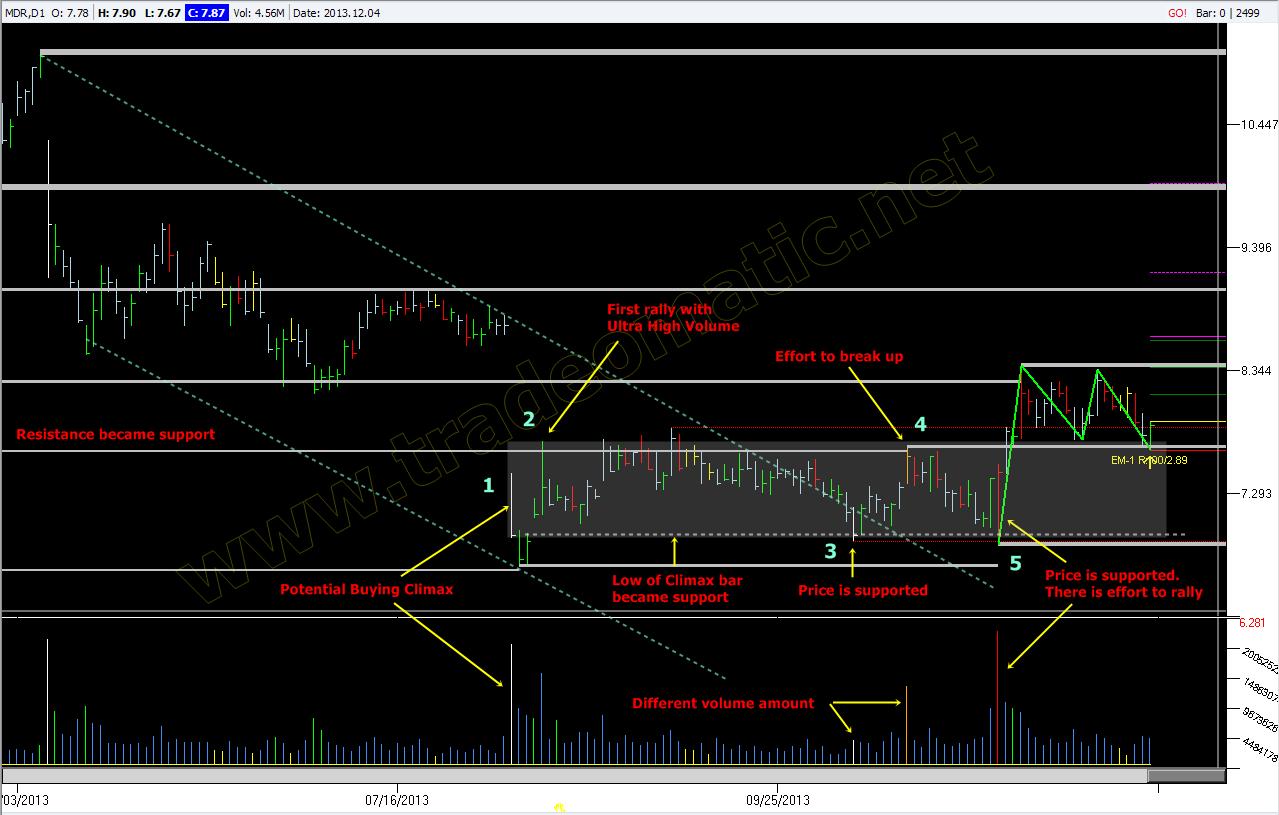
ABC pattern combine Supply Demand analysis on MDR chart
Scanning from the left, price declined from February 2013, and formed a hugeclimactic action bar on 08/06/2013 (Point 1). At this point, we do not know this bar is aselling climax to stop the downtrend or a redistribution phase that will continue the downtrend. We need more confirmation to know the potential engery of this bar.
Keep going to the right of the chart, price receivedsupport from the climactic action twice (at Point 3 and 5 in the picture). This point is added to the bullish direction of the price.
In addition, looking at point 3 and point 4, we can see big difference in volume amount at these two points. To point 4, TradeOmatic can form the trading range and track the imbalance of supply and demandof the price. At point 3, we do not see the effort to break down the low of the ultra high volume bar. In contrast, at point 4, we see high volume at resistance level, which is the effort to break that level. The price is more bullish. Point 5 is another bullish fact of the chart where price pushed through the resistance.
To this point, we can conclude that the climactic action bar on 08/06/2013 is a Selling Climax bar, which is very bullish.
And now, price came back to the resistance level to test for supply. This is a good chance to enter a long setup, right here, at the right edge of the chart. And TradeOmatic shows that an EM-1 setup today where we are in the same direction with the background. May we expect to see a good rally from this point?
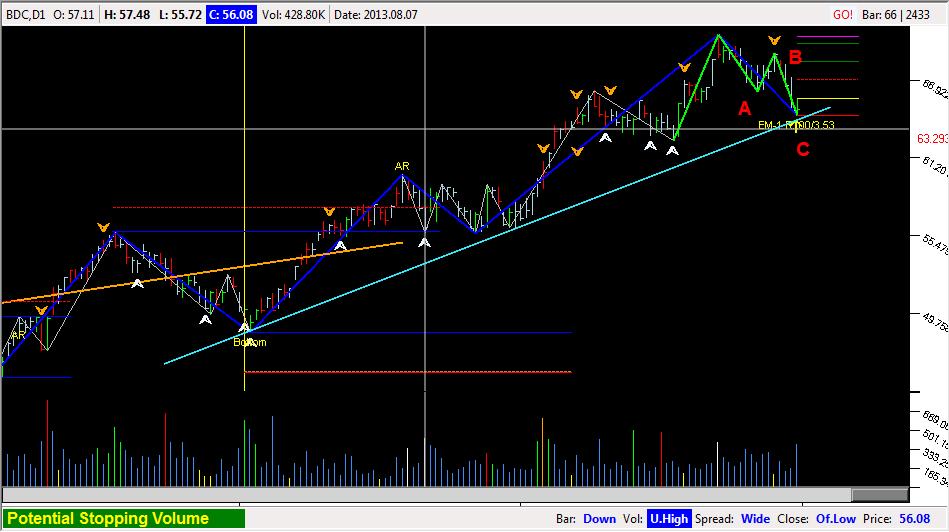
Suppy & Demand Analysis in Wyckoff phases with Elliot corrective wave on chart FSLR – 12/11/2013
FSLR is one of two good EM-1 setups that our scanner can pick up today. It has pretty good score as of 0. This symbol currently has a high probability trade setup on the right edge of the chart. Let’s see how it can be high probability.
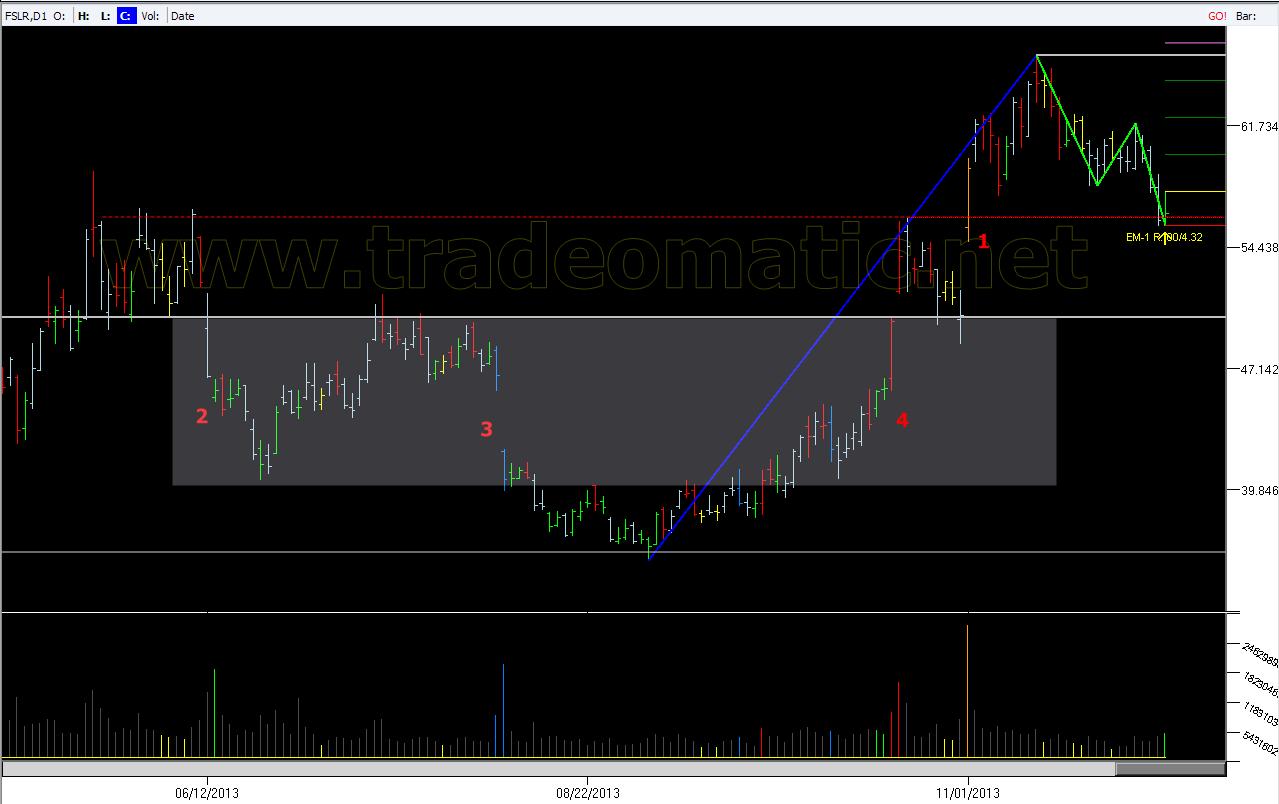
Started from 06/13/2013, the chart had some climactic action (Point 2). Especially on 08/07/2013, the chart formed a narrow spread bar on huge volume (Point 3). At this point, we can see the smart money was absorbing the shares. In other words, it’s a huge stopping volume right there within this bar. Price moved within a trading range after that. The chart area from June 2013 to August 2013 now played a role as major resistance above the current trading range. In terms of Wyckoff trading, this above the head resistance is the creek where price must break it before moving upward.
On 10/18/2013 and a few days after that, price with effort pushed the itself through the resistance above the head (Point 4). Or it jumped the creek and prove to the world that it has strength. And right now, price came back to the high volume area to test for supply before it can move up again.
It’s not always the case where every time it will happen as we described. It’s just one of the scripts that the market makers can play. Our roles are to detect those patterns and go with it.
As we can say, this EM-1 setup has strong Supply & Demand background, plus it is currently at the support level. We think it’s worth to consider for a LONG setup.
All the facts that we posted here were provided by TradeOmatic. Our application is now capable of analyse basic Wyckoff, Supply & Demand forces of the chart. It can plot these facts onto the chart. In addition, it can combine these components into potentials trade setups with Bayesian probability and ScoreOmatic. With a clear number of probability, you can see right away how good a setup is when it’s scanned and detected by TradeOmatic.
Steps to manage a good trade
Since we receive a lot of emails asking about pending entries and how to manage the trades that we posted, this post is to answer all of it.
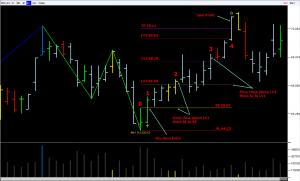
Please note that all of the trade setups that we posted clearly identify entry point, stop loss, take profit, and trailing levels. Let’s take an example by viewing the recent chart that we posted, BDC on #1
Having trading signals solely is not enough to help you to be successful in trading. With the same trading signal, different traders will come to different results. Traders have different funding capacity and psychological limit. There are ways to help you to help you to efficiently execute a good trade signal and capture most of its profit. One of those methods is to practice your trading skills which we will talk about it in this article.
Pending Entry
In the above picture, we have the entry price is just $0.01 above the high of the signal bar. The high of the bar is $65.59, we set the entry order at $65.60. We will place a Buy Stop Limit Order at this price before the next bar appears. If you trade End-of-day with stock, you will have tons of time doing this because our scanner will give you the list of the symbols that have the trade setups. The Stop Limit Order is the combination of Stopping Order and Limit Order. When we place a Buy Stop Limit Order at $65.60, it means when price claimed up and hit the stopping price ($65.60), the Limit order is activated, but it’s not executed right away. Right here, you might have to wait another moment when price came no higher than $65.60 to enter Buy.
Why Pending Entry?
Pending Entry with Stop Limit Order is one of very effective methods that help you to stay away from bad trade. In other words, the Pending Entry is only executed when price comes to your direction. Let say the above BDC chart, the next day after the signal day has lower high, and it goes down from there dramatically. If you tried to chase the market right after seeing the EM-1 signal, you are suffered from running loss at the moment.
Running loss mentally affect your trading ability with losses or running losses. Pending Entry, Cutting Loss Early, and Recalling Potential Bad Orders before execution are the methods that you can use to reduce potential losses.
Sometimes, or most of the time, you feel really want to get in a trade when you “think” it’s good. You want to jump into the trade right away because you “worry” that you will miss the chance to win. If you have any of these symptoms, you are suffered from negative trading psychology.
Pending Entry helps you not to chase the market. Let the market comes to you when it wants.
In trading, the less emotion involves, the better you are in control. That is the philosophy when we started research and develop TradeOmatic. We aim to create an application that can help traders to trade mechanically, emotionless, and profitably. The only thing you have to do is to finalize the suggested trade setup, and execute it with your own capital.
Stop Loss
With the EM-1 setup, Stop Loss is below the low of the signal bar if it’s a long setup, and is above the high of the signal bar if it’s a short setup. In the picture above, the Stop Loss is at $64.22, which is $0.01 below the low of the signal bar. For those charts with higher price, you might want to place Stop Loss with a buffer away from high and low of the signal bar. The buffer is the small about of price instead of $0.01 as we used in the example.
Why Stop Loss?
Stop Loss helps traders to clearly determine the maximum loss that they will suffer from this trade. As a rule, Stop Loss must be calculated before you enter any trades. When entering a trade, you might not know exactly where to take profit, but you must know where you will be stopped out with a loss.
Calculating Stop Loss carefully will help you to manage your capital in shape. Usually, Stop Loss is calculated to avoid margin calls and psychological damage when it really losses. Ideally, if it is a bad trade, Stop Loss will help you jump out of the trade early with minimal loss, and save the capital for the next better trade. Cutting loss early means you won’t have to witness your trade running into red zone for days. That is psychologically damaging!
How to use Stop Loss to find position sizing?
First, you must determine the amount of loss that you can suffer in a trade. For example, you want to trade the BDC chart, and the entry price is $65.60, Stop Loss is $64.22, Maximum Loss of this trade is $200, you need to have $9446.4 in capital for this trade, plus broker’s commission. The number of shares you can buy is 145.
Here is the formula to calculate the number of shares.
Number of shares = Max Loss/ABS(Entry – Stoploss)
If you stick with this rule, determine maximum potential loss before every trade, you will feel psychologically much much better.
Break Even Point
This is the first safe are where price passed it and favored your direction. In a long setup, when price closed above the Level 1, we move the Stop Loss to this Break Even Point. In the worst case (and it will happen), price comes back and hit your new stop loss, you will only have to pay the commission.
At Break Even Point, your profit is equal to your loss.
Trailing Levels LV1, LV2, LV3
We divided the distance from entry point to target to segments. Each of these segments are marked as LV1, LV2, LV3, and so on. These levels serve as Trailing Stop levels where you can adjust your Stop Loss to capture more profit when price moves in your trade’s direction.
The general rule is when price closed above the next level, move your Stop Loss to the previous level. For example, when price closes above $68.29 (Point 3 in the picture), we move Stop Loss to $66.94, which is LV1.
By applying this rule, we statically saw that we can capture the most profit out of the trade. If you are lucky, you can fully capture 100% of the target level. It happens most of the time with high score and high probability trade setups.
- Free trading apps
- Over 8,000 signals for copying
- Economic news for exploring financial markets
You agree to website policy and terms of use
Today, our trading setup scanner found one pretty handsome Elliot Wave setup on the chart of Belden Inc (BDC). Let’s look at the chart below and analyse it together.
A nice RR 3.53 - Elliow Wave setup on BDC chart, Nov 12, 2013
BDC Elliot Wave scan resultChart Analysis
BDC has been in a strong uptrend from 06/01/2012. At the current moment, we have a ABC corrective wave at the right edge of the chart. This is one of the basic Elliot setups that is detected by our developing application. In addition, the current price action nicely touches the uptrend channel line. Now, we want to catch the reverse point of the chart to resume the big up trend in the background.
Did you pay attention to the trading range to the left? That is our auto-detected Wyckoff-VSA trading range. This feature is in development right now. However, it can be used in this case. The Wyckoff trading range in the chart is for a long setup; and the current Elliot Setup is above the Wyckoff trading range with some previous price retraces. In other words, the current Elliot Wave has support from a good Wyckoff-VSA background.
Setup factor:
- Setup date 11/11/2013
- Bayesian probability of winning: 49%
- Omatic-Score of the setup: +50 point
- ABC corrective pattern in UP trend
- Enter: Buy stop at High of the current bar: $65.59
- Recommend Stop Loss: Low price of the bar with buffer = $64.32 – $0.1 = $64.22
- Recommend Take Profit: $70.11 (Risk:Reward: 1:3.53)
o Trailing lv1: $66.94
(When Low of bar above this level, move SL to break-even)
o Trailing lv2: $68.29
(When Low of bar above this level, move SL to lv1)
o Trailing lv3: $69.63
(When Low of bar above this level, move SL to lv2)
For all of the terms in this analysis, we will have another post that explains all of it (such as Bayesian Probability, Omatic-Score, etc…)
All comments are welcome