Radial Basis Network (RBN) - As Fit Filter For Price
:: I put it in back testing, but it takes much CPU processing... very slow:: How do you trade with something like this?
Interesting indicator
Hi,
Your indicator sure seems interesting - if you don't mind, I would like to know more about where you found these formula's?
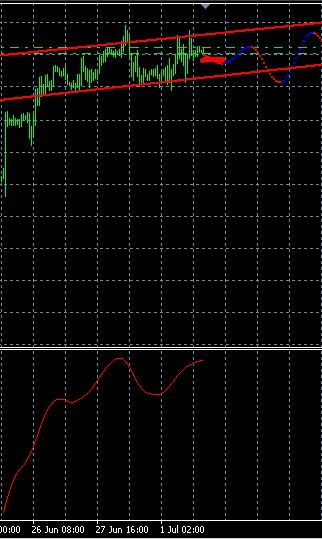
I trade something simular live... (see picture)
I use an object from Gistatgroup.com (with a whole lot of additional code etc.) so I cannot give you an indicator.
Perhaps you'd like to explore these ideas as well - if you do decide to spend a few dollars and buy that SSA component, perhaps we may work together because it seems like you and me are thinking along the same lines.
Hello everyone! I from RUSSIAN FEDERATION, sorry for my english.
I trade on FOREX (demo & real) more than 1 year.
At whole those time i search in web best for me trading system and/or indicator (expert's is too bad) and invent my own versions on them.
But all this is not working in real trade at any time with always profit.
I start to learn other modern theories like as digital filters, neural networks, wawelets, other parts of mathematics and many different.
After all, i made my new indicator with 1000% working.
I call them Rbn++.
Here its properties:
- bars=100 (how bars to visualisate)
- calculate=10000 (this parameter very important, calculating in this 10000 bars and visualisate only for bars=100)
- future=10 (how much in future calculate the forecast - points in shift grafik price)
- to_past=0 (if !=0, then calculate to N bar in the past to test indicator behaviour)
- width=5 (any variable - depend on fit)
And this is code of indicator.
Please test its in working, write comment's.
I very praise to YOU, thanks!how to use your indicator?
hm i dont get it....please explain more details...dont worry about your english
Where do you get 0.8325546 from?
try to explain this!
Where do you get 0.8325546 from?
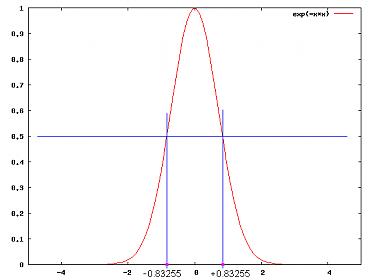
radial basis functions is exponential summetric Gaussian functions like exp(-x*x/[2*h*h]).
exp is 2.71... constant like pi=3.14159... . Gaussian functions describe and explain many (all) proceses in our world and uneverse.
for simple we use [2*h*h]=1 or exp(-x*x).
there are many classes of this functions like:
- exp(-x)
- 1/[(1+x)*(1+x)]
- 1/(1+z*z)
- x^alpha*ln(x)
- x*x+alpha*x+betta (polinomial formula) and others.
in graphik its view as old door bell _/\_ .
like binar system 1 and 0 its probability 50% and 50% is equal.
if y=exp(-x*x) and y=50% (blue horizontal level). y=1 y(50%)=0.5
and x=sqrt[-ln(0.5)]=0.83255 (+ and -). for other functions its different.
and parameter of indicator width=5 its depend on this number 0.83255/width like normalization (change this to 1 and see how its look).
its very simple to use indicator: add it to chart window with default settings (euro usd) and see where 10 red predicted balls on price look: for(i=0;i>-10;i--) i0 bigger i-1 bigger i-2 bigger i-3 ... BUY
for SELL i0 less i-1 less i-2 less i-3 ...
and red line in separate window (last 3 or 5 bars) have max or min and invert to other side - this is signal. (if max and fall & red ball is down - SELL).
in source you may add new function (for expample copy def to def_new in which close price is replase to open and add in header new second buffer) and then red cross blue from down to up - BUY, to SELL - cross from up to down (see in Rbn++_Double.mq4 test in history use to_past settings).
you can aproximate any discreet function (like MA in each bar just add it instead close price in def).
indicator use neual net in its basic rule like regression with 1000% prediction power.
take profit friends!!!
icexp
icexp you are the man nice idea thanks for your effort
but does this indicator repaint the past
and can you post the code to apply it to moving average instead of close
sory i am not a programmer
but maybe it will work well
can we applied also to any custom indicator like the one attached the xpma
Thanks for the explanation. I've PM-ed you with my notes.
This indicator repaints
SMA with IceXP RBN
icexp you are the man nice idea thanks for your effort
but does this indicator repaint the past
and can you post the code to apply it to moving average instead of close
sory i am not a programmer
but maybe it will work well
can we applied also to any custom indicator like the one attached the xpmaI have applied IceXP method to predict the SMA, the reason to use SMA(Simble Moving Avarage) is that I can extract the close price from it easly using simple math, other MA types needs Trial-and-Error resurcive methods to get the Close price from the MA.
However, the prediction was good for the MA (especially if parameter width is less then 1), but the Close price extracted from the predicted MA is not so good.
I will post the results soon, I just need to try some more patameters to the Gaussian function as IceXP explained.
This indicator repaints
This indicator does not repaint, but I found a shift of one bar in IceXP code, I will post the slightly modified version tonight.
Thanks IceXP for the good theory.
- Free trading apps
- Over 8,000 signals for copying
- Economic news for exploring financial markets
You agree to website policy and terms of use
Hello everyone! I from RUSSIAN FEDERATION, sorry for my english.
I trade on FOREX (demo & real) more than 1 year.
At whole those time i search in web best for me trading system and/or indicator (expert's is too bad) and invent my own versions on them.
But all this is not working in real trade at any time with always profit.
I start to learn other modern theories like as digital filters, neural networks, wawelets, other parts of mathematics and many different.
After all, i made my new indicator with 1000% working.
I call them Rbn++.
Here its properties:
- bars=100 (how bars to visualisate)
- calculate=10000 (this parameter very important, calculating in this 10000 bars and visualisate only for bars=100)
- future=10 (how much in future calculate the forecast - points in shift grafik price)
- to_past=0 (if !=0, then calculate to N bar in the past to test indicator behaviour)
- width=5 (any variable - depend on fit)
And this is code of indicator.
Please test its in working, write comment's.
I very praise to YOU, thanks!