Correlation indicators
correlation indicators
I only see the red when i placed the indicator.
Any suggestion?
what is telling you this indicator? How do you use it?
used to se wich currency is stronger than other also usefull to se if currencie pair moves in same direction or not... Here is a web page with an excel based correlation spreadsheet also nice and may explain correlation better than i can do :-) http://www.mataf.net/en/analysis-correlation_id.htm Enjoy and happy trading
Sailor from denmark
Often i like to make 3 trades based on EURUSD GBPUSD and EURGBP at same time im bad to explain in english :-( so hope u find the home page usefull
Try and put Mindex with EUR - USD and GBP in same window (Drag and drop )Also use the option box to change colors if u want
Sailor from denmark
add a GBP/USD chart. add the indicator to the chart and in properties u notice its set for usd so it will show usd data. now add another instance of the indicator to the same window and change properties to GBP and change the color if you like and then it will show USD and GBP's data on the same window
Thank you sailor and lowphat,
what point do you use to enter your trades, based on this indicator?
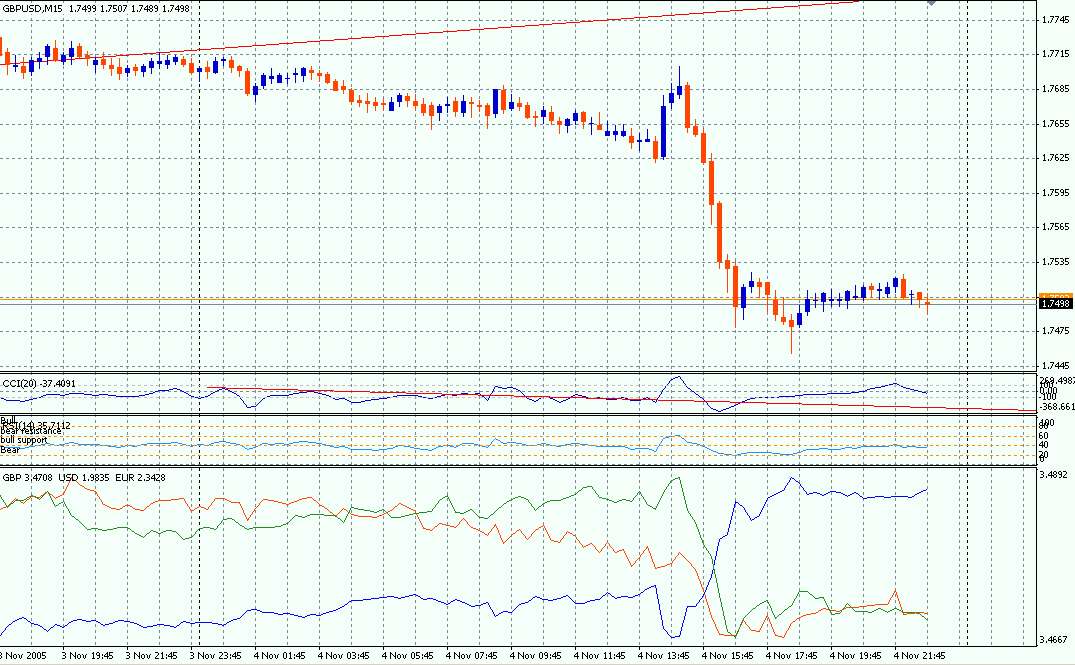
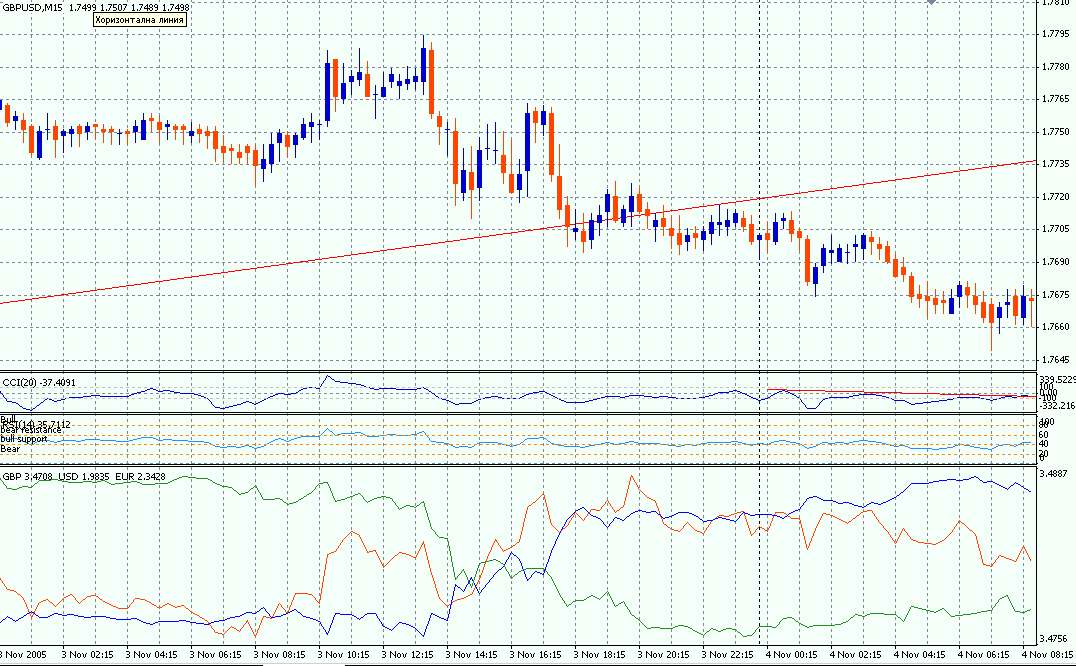
Here at these charts eur is red gbp is yellow usd blue.... i see usd as strongest then gbp and last euro but this is a 60 min chart so the picture may not be the same in higher timeframes like every other indicators have good sites and bad sites... but i like the crosses, i have put it in with some examples (shapes). On the higher timeframes i use it as a leading indicator also and consider which currencie are strongest against other hopefully deciding which way to go :-)


sailor,
if you move the chart to the right or to the left side you can see that the three indexes change the places where they cross. Look the pictures i attached to see what I mean. How can you be sure it is the right cross?
BTW if you speak german better you could write in german.
sailor, BTW if you speak german better you could write in german.
We all from the different countries here and we have to use one language.
Please, in English only.
ok, sorry,
I didn't think about it. But if you would like to write in german you can send me a personal message.
- Free trading apps
- Over 8,000 signals for copying
- Economic news for exploring financial markets
You agree to website policy and terms of use
a nice indicator i think green GBP /red USD se the pic