Jackson Zones
Never heard about it. If u can describe, usage of it, and calculations, we can make it.
hi kelnzo
i agree with holgar.
we have two kinds of historical analisis based on the historical(previous's0days high ,low close and range.one of these analisis is jackson's zone and the other is fibo zone.these zaones divided into 6 part
zone 1,2 ,3,4,5,6. according to the historical data and analisis based on them some percentage will be find,u can find it in Fibonacci Trader sofware.
let me attach a pdf wich describe the formula wich be used for calcualation
here is complete description if u make this indicator(or software)it would be grate
Hello!
Does someone have this indicator?
Jackson Zones
Best Regards
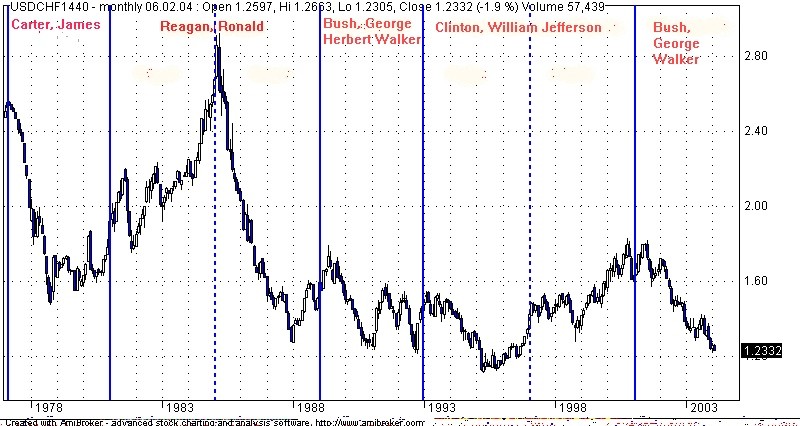
HolgerI know about Carter Zone (20.01.1977 - 20.01.1981), Reagan Zone (20.01.1981 - 20.01.1989) and so on. As to Jackson Zone so it was many years ago (4.03.1829 - 3.03.1837) and I do not have forex data for that time.
it's ok ?
Hi,
i don't know if calculation are correct,but it's first try/version.
- see expert log for zone Probability.
Cheers.
Hi,
i don't know if calculation are correct,but it's first try/version.
- see expert log for zone Probability.
Cheers.Sweet  Good work!
Hi,
i don't know if calculation are correct,but it's first try/version.
- see expert log for zone Probability.
Cheers.hi master shadowwz
again u and me 
ok take a look at the pics
it would be good if u would make an alert window(with out sound of cours)that show the zones and prices and percemtages like thi little pic that i attached beside if u would be able to kake the indicator plot the zones and res/sup bands on charts.
as probably u know there are some importants point.
1-to have a good fiboZone matrix u need at least 10-12 years historical data
2-another point is the indicator should use daily candles for analisis and making the matrix.but the zones and percentages can be used for other TFs(lower than daily)
also take a look at the pdf that i attached above.it may help u
thanks for sharing and your talent in coding
kamyar
Jackson Zone
@ShadowWz Good work!!!!!!
can you try Fibonacci to take into consideration?
description:
http://trader.online.pl/MSZ/e-w-Jackson_Zones.html
@ newdigital we have the Merkel Zone
I was joking.

hi master shadowwz
again u and me
Hi &) kamyar,
it would be good if u would make an alert window(with out sound of cours)that show the zones and prices and percemtages like thi little pic that i attached beside if u would be able to kake the indicator plot the zones and res/sup bands on charts.
i will see what i can do,i could create such window -not with MT script ofcourse,but it will be complicated.i think about additional indicator window - like MACD,but insted of graphics it will contain text information - like table at the picture.what do you think ?
as probably u know there are some importants point.
1-to have a good fiboZone matrix u need at least 10-12 years historical data
yes,for accuracity - the more data you have the more accurate are probabilities.
2-another point is the indicator should use daily candles for analisis and making the matrix.but the zones and percentages can be used for other TFs(lower than daily)
you mean TF by wich the matrix will be constructed will be not only Daily,any ?
- currently the indicator only use Daily TF,not matter where you attach it.
Cheers.
hi shadowwz
thanks for your attention.about this
u right the matrix will be calculated by daily candles and can be attached to all TFs
thanks
kamyar
- Free trading apps
- Over 8,000 signals for copying
- Economic news for exploring financial markets
You agree to website policy and terms of use
Hello!
Does someone have this indicator?
Jackson Zones
Best Regards
Holger